|
Download Data (XLS File) |
|
|||||
|
|||||
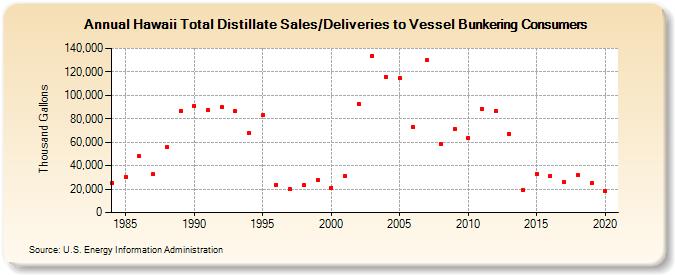
| Hawaii Total Distillate Sales/Deliveries to Vessel Bunkering Consumers (Thousand Gallons) | |||||
| Decade | Year-0 | Year-1 | Year-2 | Year-3 | Year-4 | Year-5 | Year-6 | Year-7 | Year-8 | Year-9 |
|---|---|---|---|---|---|---|---|---|---|---|
| 1980's | 25,026 | 30,399 | 47,821 | 32,488 | 55,937 | 86,679 | ||||
| 1990's | 91,058 | 87,333 | 89,697 | 86,376 | 67,509 | 82,814 | 23,722 | 19,824 | 23,112 | 27,993 |
| 2000's | 21,188 | 31,332 | 92,960 | 133,725 | 115,769 | 114,465 | 72,935 | 129,743 | 58,786 | 71,496 |
| 2010's | 63,757 | 88,652 | 86,663 | 67,396 | 19,313 | 33,189 | 31,575 | 26,197 | 31,989 | 24,790 |
| 2020's | 18,296 |
| - = No Data Reported; -- = Not Applicable; NA = Not Available; W = Withheld to avoid disclosure of individual company data. |
| Release Date: 2/9/2022 |
| Next Release Date: Suspended |