|
Download Data (XLS File) |
|
|||||
|
|||||
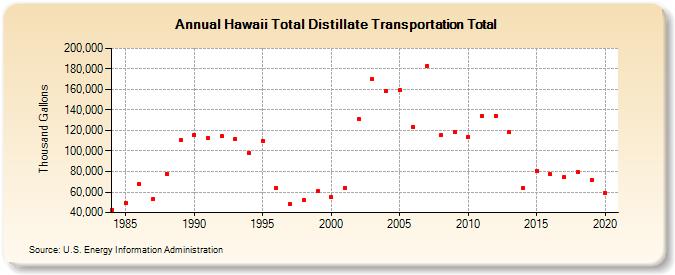
| Hawaii Total Distillate Transportation Total (Thousand Gallons) | |||||
| Decade | Year-0 | Year-1 | Year-2 | Year-3 | Year-4 | Year-5 | Year-6 | Year-7 | Year-8 | Year-9 |
|---|---|---|---|---|---|---|---|---|---|---|
| 1980's | 42,910 | 49,251 | 67,653 | 52,742 | 77,890 | 110,413 | ||||
| 1990's | 116,044 | 112,709 | 114,569 | 111,956 | 98,158 | 109,894 | 64,169 | 48,311 | 52,068 | 60,673 |
| 2000's | 54,694 | 64,086 | 131,082 | 170,356 | 158,557 | 159,121 | 123,762 | 182,439 | 115,186 | 118,348 |
| 2010's | 113,981 | 134,448 | 134,564 | 118,168 | 63,898 | 80,653 | 77,326 | 74,322 | 79,683 | 71,788 |
| 2020's | 59,243 |
| - = No Data Reported; -- = Not Applicable; NA = Not Available; W = Withheld to avoid disclosure of individual company data. |
| Release Date: 2/9/2022 |
| Next Release Date: Suspended |