|
Download Data (XLS File) |
|
|||||
|
|||||
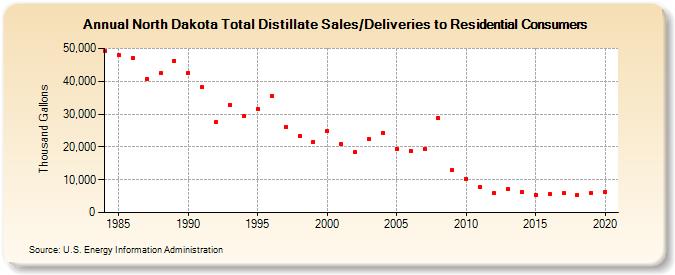
| North Dakota Total Distillate Sales/Deliveries to Residential Consumers (Thousand Gallons) | |||||
| Decade | Year-0 | Year-1 | Year-2 | Year-3 | Year-4 | Year-5 | Year-6 | Year-7 | Year-8 | Year-9 |
|---|---|---|---|---|---|---|---|---|---|---|
| 1980's | 49,332 | 47,884 | 47,177 | 40,635 | 42,382 | 46,192 | ||||
| 1990's | 42,526 | 38,170 | 27,609 | 32,869 | 29,293 | 31,656 | 35,548 | 26,188 | 23,351 | 21,503 |
| 2000's | 24,800 | 20,943 | 18,335 | 22,385 | 24,368 | 19,311 | 18,823 | 19,370 | 28,770 | 13,014 |
| 2010's | 10,319 | 7,738 | 5,808 | 7,115 | 6,371 | 5,371 | 5,643 | 5,930 | 5,423 | 5,970 |
| 2020's | 6,376 |
| - = No Data Reported; -- = Not Applicable; NA = Not Available; W = Withheld to avoid disclosure of individual company data. |
| Release Date: 2/9/2022 |
| Next Release Date: Suspended |