|
Download Data (XLS File) |
|
|||||
|
|||||
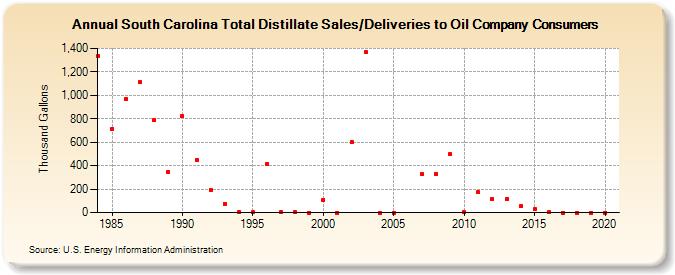
| South Carolina Total Distillate Sales/Deliveries to Oil Company Consumers (Thousand Gallons) | |||||
| Decade | Year-0 | Year-1 | Year-2 | Year-3 | Year-4 | Year-5 | Year-6 | Year-7 | Year-8 | Year-9 |
|---|---|---|---|---|---|---|---|---|---|---|
| 1980's | 1,336 | 715 | 970 | 1,111 | 787 | 344 | ||||
| 1990's | 824 | 450 | 194 | 77 | 1 | 1 | 416 | 1 | 5 | 0 |
| 2000's | 110 | 0 | 603 | 1,371 | 0 | 0 | -- | 329 | 332 | 497 |
| 2010's | 2 | 174 | 114 | 115 | 54 | 28 | 4 | 0 | 0 | 0 |
| 2020's | 0 |
| - = No Data Reported; -- = Not Applicable; NA = Not Available; W = Withheld to avoid disclosure of individual company data. |
| Release Date: 2/9/2022 |
| Next Release Date: Suspended |