|
Download Data (XLS File) |
|
|||||
|
|||||
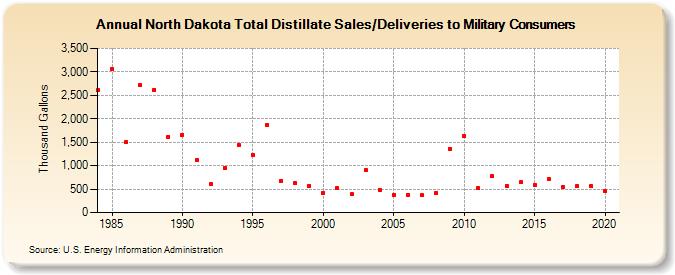
| North Dakota Total Distillate Sales/Deliveries to Military Consumers (Thousand Gallons) | |||||
| Decade | Year-0 | Year-1 | Year-2 | Year-3 | Year-4 | Year-5 | Year-6 | Year-7 | Year-8 | Year-9 |
|---|---|---|---|---|---|---|---|---|---|---|
| 1980's | 2,618 | 3,065 | 1,496 | 2,715 | 2,620 | 1,620 | ||||
| 1990's | 1,662 | 1,118 | 605 | 957 | 1,444 | 1,230 | 1,874 | 679 | 625 | 568 |
| 2000's | 417 | 517 | 395 | 912 | 487 | 384 | 385 | 367 | 422 | 1,361 |
| 2010's | 1,625 | 522 | 773 | 567 | 642 | 597 | 726 | 546 | 561 | 559 |
| 2020's | 458 |
| - = No Data Reported; -- = Not Applicable; NA = Not Available; W = Withheld to avoid disclosure of individual company data. |
| Release Date: 2/9/2022 |
| Next Release Date: Suspended |