|
Download Data (XLS File) |
|
|||||
|
|||||
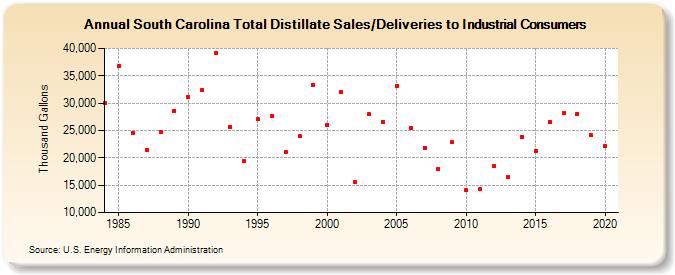
| South Carolina Total Distillate Sales/Deliveries to Industrial Consumers (Thousand Gallons) | |||||
| Decade | Year-0 | Year-1 | Year-2 | Year-3 | Year-4 | Year-5 | Year-6 | Year-7 | Year-8 | Year-9 |
|---|---|---|---|---|---|---|---|---|---|---|
| 1980's | 30,043 | 36,783 | 24,595 | 21,495 | 24,788 | 28,586 | ||||
| 1990's | 31,144 | 32,411 | 39,116 | 25,673 | 19,411 | 27,022 | 27,694 | 21,057 | 23,907 | 33,375 |
| 2000's | 26,047 | 32,094 | 15,506 | 27,943 | 26,605 | 33,195 | 25,440 | 21,806 | 17,997 | 22,814 |
| 2010's | 14,059 | 14,385 | 18,465 | 16,556 | 23,788 | 21,220 | 26,639 | 28,225 | 28,071 | 24,116 |
| 2020's | 22,081 |
| - = No Data Reported; -- = Not Applicable; NA = Not Available; W = Withheld to avoid disclosure of individual company data. |
| Release Date: 2/9/2022 |
| Next Release Date: Suspended |