|
Download Data (XLS File) |
|
|||||
|
|||||
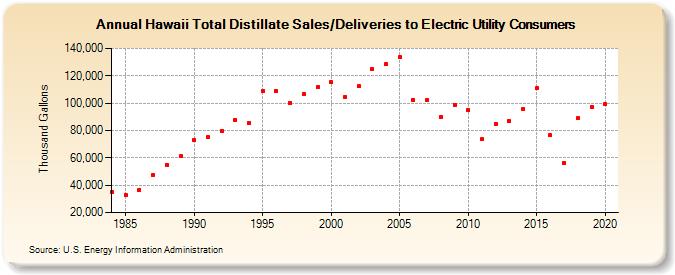
| Hawaii Total Distillate Sales/Deliveries to Electric Utility Consumers (Thousand Gallons) | |||||
| Decade | Year-0 | Year-1 | Year-2 | Year-3 | Year-4 | Year-5 | Year-6 | Year-7 | Year-8 | Year-9 |
|---|---|---|---|---|---|---|---|---|---|---|
| 1980's | 35,322 | 32,570 | 36,576 | 47,531 | 54,780 | 61,077 | ||||
| 1990's | 72,936 | 75,134 | 79,953 | 87,683 | 85,537 | 108,713 | 108,863 | 100,324 | 106,517 | 111,661 |
| 2000's | 115,238 | 104,601 | 112,254 | 124,840 | 128,272 | 133,828 | 102,539 | 102,522 | 89,519 | 98,646 |
| 2010's | 95,097 | 73,485 | 85,051 | 86,718 | 95,420 | 110,805 | 76,497 | 56,475 | 88,820 | 97,101 |
| 2020's | 99,020 |
| - = No Data Reported; -- = Not Applicable; NA = Not Available; W = Withheld to avoid disclosure of individual company data. |
| Release Date: 2/9/2022 |
| Next Release Date: Suspended |