|
Download Data (XLS File) |
|
|||||
|
|||||
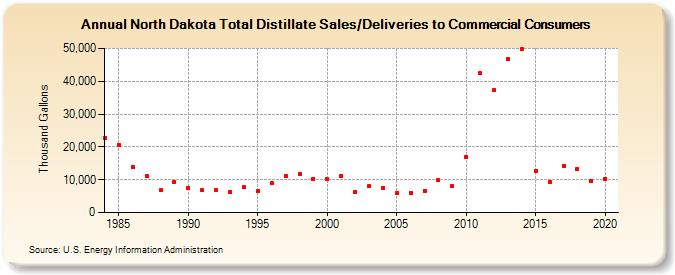
| North Dakota Total Distillate Sales/Deliveries to Commercial Consumers (Thousand Gallons) | |||||
| Decade | Year-0 | Year-1 | Year-2 | Year-3 | Year-4 | Year-5 | Year-6 | Year-7 | Year-8 | Year-9 |
|---|---|---|---|---|---|---|---|---|---|---|
| 1980's | 22,773 | 20,699 | 14,011 | 10,986 | 6,763 | 9,402 | ||||
| 1990's | 7,597 | 6,758 | 6,770 | 6,262 | 7,687 | 6,534 | 9,062 | 11,193 | 11,818 | 10,373 |
| 2000's | 10,187 | 11,144 | 6,121 | 7,942 | 7,539 | 5,922 | 6,096 | 6,605 | 9,812 | 8,053 |
| 2010's | 17,027 | 42,391 | 37,400 | 46,740 | 49,771 | 12,762 | 9,323 | 14,178 | 13,289 | 9,755 |
| 2020's | 10,341 |
| - = No Data Reported; -- = Not Applicable; NA = Not Available; W = Withheld to avoid disclosure of individual company data. |
| Release Date: 2/9/2022 |
| Next Release Date: Suspended |