|
Download Data (XLS File) |
|
|||||
|
|||||
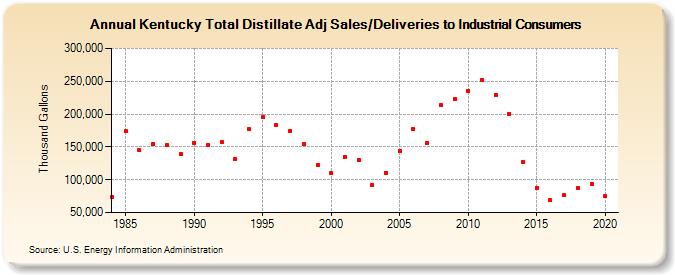
| Kentucky Total Distillate Adj Sales/Deliveries to Industrial Consumers (Thousand Gallons) | |||||
| Decade | Year-0 | Year-1 | Year-2 | Year-3 | Year-4 | Year-5 | Year-6 | Year-7 | Year-8 | Year-9 |
|---|---|---|---|---|---|---|---|---|---|---|
| 1980's | 73,449 | 173,474 | 144,857 | 154,523 | 152,600 | 139,924 | ||||
| 1990's | 155,708 | 153,604 | 156,845 | 131,138 | 176,657 | 195,758 | 183,408 | 173,847 | 154,029 | 122,601 |
| 2000's | 110,238 | 135,025 | 130,323 | 91,987 | 110,889 | 143,409 | 176,784 | 155,891 | 213,437 | 222,365 |
| 2010's | 235,299 | 252,017 | 229,213 | 200,195 | 126,664 | 88,017 | 68,411 | 76,107 | 87,770 | 94,032 |
| 2020's | 74,728 |
| - = No Data Reported; -- = Not Applicable; NA = Not Available; W = Withheld to avoid disclosure of individual company data. |
| Release Date: 2/9/2022 |
| Next Release Date: Suspended |