|
Download Data (XLS File) |
|
|||||
|
|||||
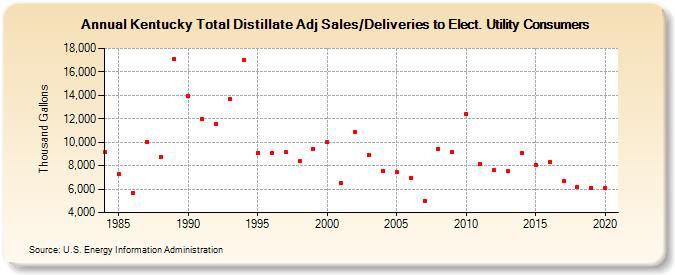
| Kentucky Total Distillate Adj Sales/Deliveries to Elect. Utility Consumers (Thousand Gallons) | |||||
| Decade | Year-0 | Year-1 | Year-2 | Year-3 | Year-4 | Year-5 | Year-6 | Year-7 | Year-8 | Year-9 |
|---|---|---|---|---|---|---|---|---|---|---|
| 1980's | 9,134 | 7,297 | 5,698 | 10,033 | 8,740 | 17,107 | ||||
| 1990's | 13,906 | 11,959 | 11,587 | 13,696 | 17,001 | 9,092 | 9,057 | 9,159 | 8,374 | 9,402 |
| 2000's | 10,033 | 6,561 | 10,857 | 8,930 | 7,547 | 7,452 | 6,947 | 4,989 | 9,436 | 9,144 |
| 2010's | 12,433 | 8,174 | 7,614 | 7,522 | 9,041 | 8,080 | 8,339 | 6,652 | 6,175 | 6,126 |
| 2020's | 6,130 |
| - = No Data Reported; -- = Not Applicable; NA = Not Available; W = Withheld to avoid disclosure of individual company data. |
| Release Date: 2/9/2022 |
| Next Release Date: Suspended |