|
Download Data (XLS File) |
|
|||||
|
|||||
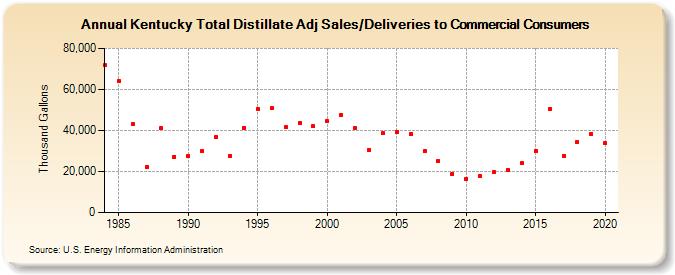
| Kentucky Total Distillate Adj Sales/Deliveries to Commercial Consumers (Thousand Gallons) | |||||
| Decade | Year-0 | Year-1 | Year-2 | Year-3 | Year-4 | Year-5 | Year-6 | Year-7 | Year-8 | Year-9 |
|---|---|---|---|---|---|---|---|---|---|---|
| 1980's | 71,769 | 64,027 | 43,004 | 22,393 | 40,976 | 27,261 | ||||
| 1990's | 27,491 | 30,046 | 36,893 | 27,793 | 41,448 | 50,597 | 50,824 | 41,550 | 43,758 | 41,939 |
| 2000's | 44,430 | 47,706 | 41,105 | 30,500 | 38,568 | 39,150 | 38,265 | 29,971 | 25,146 | 18,978 |
| 2010's | 16,498 | 17,723 | 19,569 | 20,871 | 24,139 | 29,855 | 50,499 | 27,582 | 34,311 | 38,428 |
| 2020's | 33,764 |
| - = No Data Reported; -- = Not Applicable; NA = Not Available; W = Withheld to avoid disclosure of individual company data. |
| Release Date: 2/9/2022 |
| Next Release Date: Suspended |