|
Download Data (XLS File) |
|
|||||
|
|||||
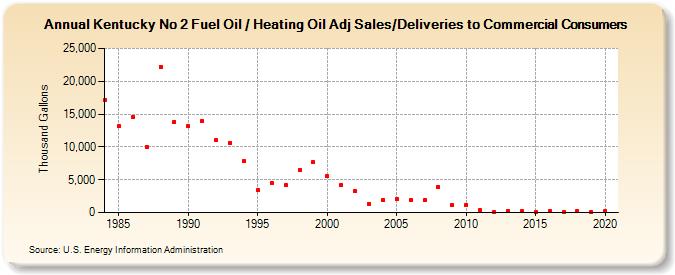
| Kentucky No 2 Fuel Oil / Heating Oil Adj Sales/Deliveries to Commercial Consumers (Thousand Gallons) | |||||
| Decade | Year-0 | Year-1 | Year-2 | Year-3 | Year-4 | Year-5 | Year-6 | Year-7 | Year-8 | Year-9 |
|---|---|---|---|---|---|---|---|---|---|---|
| 1980's | 17,112 | 13,165 | 14,506 | 10,039 | 22,199 | 13,858 | ||||
| 1990's | 13,113 | 13,909 | 10,995 | 10,635 | 7,826 | 3,368 | 4,528 | 4,123 | 6,513 | 7,631 |
| 2000's | 5,561 | 4,144 | 3,232 | 1,329 | 1,933 | 2,012 | 1,843 | 1,854 | 3,899 | 1,139 |
| 2010's | 1,201 | 325 | 121 | 272 | 171 | 87 | 214 | 78 | 178 | 91 |
| 2020's | 258 |
| - = No Data Reported; -- = Not Applicable; NA = Not Available; W = Withheld to avoid disclosure of individual company data. |
| Release Date: 2/9/2022 |
| Next Release Date: Suspended |