|
Download Data (XLS File) |
|
|||||
|
|||||
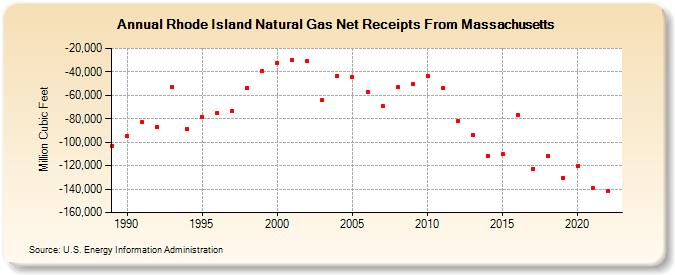
| Rhode Island Natural Gas Net Receipts From Massachusetts (Million Cubic Feet) | |||||
| Decade | Year-0 | Year-1 | Year-2 | Year-3 | Year-4 | Year-5 | Year-6 | Year-7 | Year-8 | Year-9 |
|---|---|---|---|---|---|---|---|---|---|---|
| 1980's | -102,992 | |||||||||
| 1990's | -94,343 | -82,648 | -87,238 | -52,708 | -88,702 | -78,107 | -74,699 | -73,335 | -53,745 | -39,396 |
| 2000's | -32,174 | -30,028 | -30,950 | -64,104 | -43,127 | -44,029 | -57,052 | -69,474 | -53,230 | -50,758 |
| 2010's | -43,197 | -53,901 | -82,009 | -93,508 | -111,503 | -110,437 | -76,487 | -122,695 | -111,464 | -130,122 |
| 2020's | -120,241 | -139,007 | -141,712 |
| - = No Data Reported; -- = Not Applicable; NA = Not Available; W = Withheld to avoid disclosure of individual company data. |
| Release Date: 3/29/2024 |
| Next Release Date: 4/30/2024 |