|
Download Data (XLS File) |
|
||||||||
|
||||||||
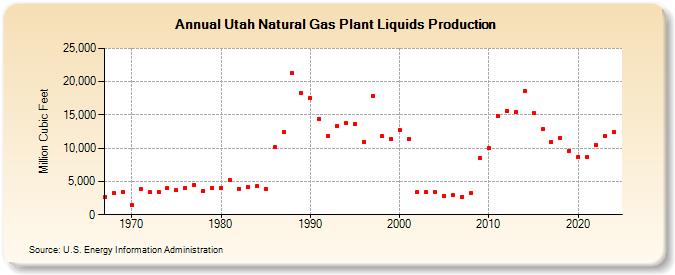
| Utah Natural Gas Plant Liquids Production (Million Cubic Feet) | ||||||||
| Decade | Year-0 | Year-1 | Year-2 | Year-3 | Year-4 | Year-5 | Year-6 | Year-7 | Year-8 | Year-9 |
|---|---|---|---|---|---|---|---|---|---|---|
| 1960's | 2,633 | 3,266 | 3,412 | |||||||
| 1970's | 1,493 | 3,822 | 3,382 | 3,489 | 3,958 | 3,659 | 4,032 | 4,524 | 3,570 | 3,950 |
| 1980's | 4,075 | 5,219 | 3,930 | 4,180 | 4,259 | 3,874 | 10,139 | 12,396 | 21,237 | 18,302 |
| 1990's | 17,579 | 14,392 | 11,851 | 13,300 | 13,780 | 13,679 | 10,970 | 17,872 | 11,801 | 11,407 |
| 2000's | 12,795 | 11,379 | 3,352 | 3,404 | 3,381 | 2,815 | 2,911 | 2,729 | 3,280 | 8,489 |
| 2010's | 9,978 | 14,910 | 15,637 | 15,409 | 18,652 | 15,298 | 12,832 | 10,945 | 11,562 | 9,651 |
| 2020's | 8,750 | 8,638 | 10,473 |
| - = No Data Reported; -- = Not Applicable; NA = Not Available; W = Withheld to avoid disclosure of individual company data. |
| Release Date: 3/29/2024 |
| Next Release Date: 4/30/2024 |