|
Download Data (XLS File) |
|
||||||||
|
||||||||
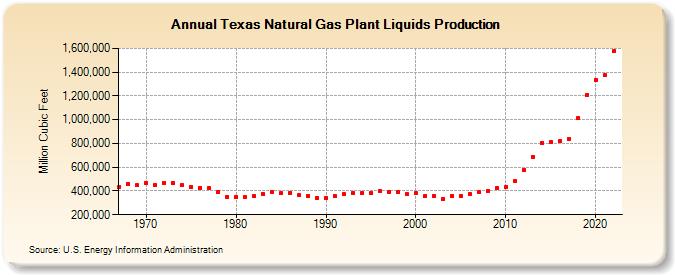
| Texas Natural Gas Plant Liquids Production (Million Cubic Feet) | ||||||||
| Decade | Year-0 | Year-1 | Year-2 | Year-3 | Year-4 | Year-5 | Year-6 | Year-7 | Year-8 | Year-9 |
|---|---|---|---|---|---|---|---|---|---|---|
| 1960's | 433,684 | 457,117 | 447,325 | |||||||
| 1970's | 466,016 | 448,288 | 470,105 | 466,143 | 448,993 | 435,571 | 428,635 | 421,110 | 393,819 | 352,650 |
| 1980's | 350,312 | 345,262 | 356,406 | 375,849 | 393,873 | 383,719 | 384,693 | 364,477 | 357,756 | 343,233 |
| 1990's | 342,186 | 353,737 | 374,126 | 385,063 | 381,020 | 381,712 | 398,442 | 391,174 | 388,011 | 372,566 |
| 2000's | 380,535 | 355,860 | 360,535 | 332,405 | 360,110 | 355,589 | 373,350 | 387,349 | 401,503 | 424,042 |
| 2010's | 433,622 | 481,308 | 579,410 | 689,887 | 806,794 | 810,121 | 819,021 | 840,601 | 1,011,753 | 1,208,021 |
| 2020's | 1,336,905 | 1,372,579 | 1,581,347 |
| - = No Data Reported; -- = Not Applicable; NA = Not Available; W = Withheld to avoid disclosure of individual company data. |
| Release Date: 3/29/2024 |
| Next Release Date: 4/30/2024 |