|
Download Data (XLS File) |
|
||||||||
|
||||||||
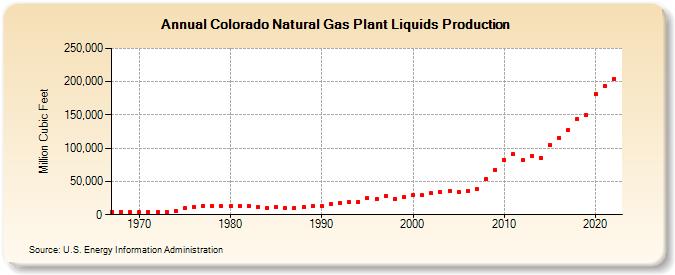
| Colorado Natural Gas Plant Liquids Production (Million Cubic Feet) | ||||||||
| Decade | Year-0 | Year-1 | Year-2 | Year-3 | Year-4 | Year-5 | Year-6 | Year-7 | Year-8 | Year-9 |
|---|---|---|---|---|---|---|---|---|---|---|
| 1960's | 4,126 | 4,546 | 4,058 | |||||||
| 1970's | 3,405 | 4,152 | 4,114 | 4,674 | 6,210 | 9,620 | 11,944 | 13,507 | 13,094 | 12,606 |
| 1980's | 12,651 | 13,427 | 12,962 | 11,314 | 10,771 | 11,913 | 10,441 | 10,195 | 11,589 | 13,340 |
| 1990's | 13,178 | 15,822 | 18,149 | 18,658 | 19,612 | 25,225 | 23,362 | 28,851 | 24,365 | 26,423 |
| 2000's | 29,105 | 29,195 | 31,952 | 33,650 | 35,821 | 34,782 | 36,317 | 38,180 | 53,590 | 67,607 |
| 2010's | 82,637 | 90,801 | 82,042 | 87,513 | 85,198 | 104,633 | 115,353 | 127,456 | 143,285 | 149,988 |
| 2020's | 181,689 | 192,941 | 204,738 |
| - = No Data Reported; -- = Not Applicable; NA = Not Available; W = Withheld to avoid disclosure of individual company data. |
| Release Date: 3/29/2024 |
| Next Release Date: 4/30/2024 |