|
Download Data (XLS File) |
|
||||||||
|
||||||||
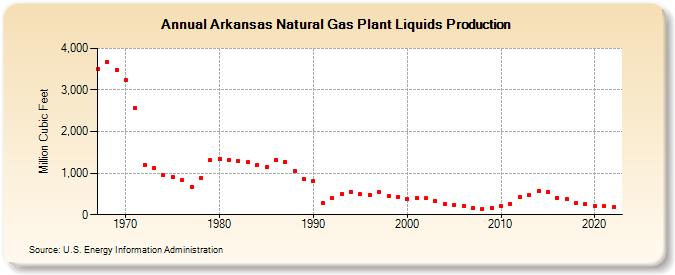
| Arkansas Natural Gas Plant Liquids Production (Million Cubic Feet) | ||||||||
| Decade | Year-0 | Year-1 | Year-2 | Year-3 | Year-4 | Year-5 | Year-6 | Year-7 | Year-8 | Year-9 |
|---|---|---|---|---|---|---|---|---|---|---|
| 1960's | 3,499 | 3,667 | 3,475 | |||||||
| 1970's | 3,235 | 2,563 | 1,197 | 1,118 | 952 | 899 | 823 | 674 | 883 | 1,308 |
| 1980's | 1,351 | 1,327 | 1,287 | 1,258 | 1,200 | 1,141 | 1,318 | 1,275 | 1,061 | 849 |
| 1990's | 800 | 290 | 413 | 507 | 553 | 488 | 479 | 554 | 451 | 431 |
| 2000's | 377 | 408 | 395 | 320 | 254 | 231 | 212 | 162 | 139 | 168 |
| 2010's | 213 | 268 | 424 | 486 | 582 | 551 | 411 | 377 | 284 | 257 |
| 2020's | 210 | 202 | 181 |
| - = No Data Reported; -- = Not Applicable; NA = Not Available; W = Withheld to avoid disclosure of individual company data. |
| Release Date: 3/29/2024 |
| Next Release Date: 4/30/2024 |