|
Download Data (XLS File) |
|
||||||||
|
||||||||
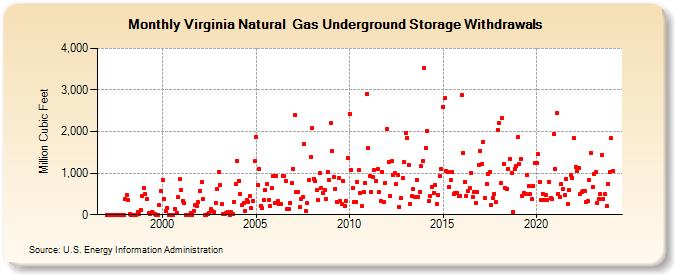
| Virginia Natural Gas Underground Storage Withdrawals (Million Cubic Feet) | ||||||||
| Year | Jan | Feb | Mar | Apr | May | Jun | Jul | Aug | Sep | Oct | Nov | Dec |
|---|---|---|---|---|---|---|---|---|---|---|---|---|
| 1997 | 0 | 0 | 0 | 0 | 0 | 0 | 0 | 0 | 0 | 0 | 0 | 0 |
| 1998 | 366 | 467 | 353 | 17 | 0 | 0 | 0 | 0 | 57 | 21 | 125 | 455 |
| 1999 | 633 | 499 | 368 | 37 | 6 | 54 | 38 | 29 | 0 | 0 | 226 | 580 |
| 2000 | 845 | 376 | 79 | 165 | 0 | 0 | 0 | 0 | 148 | 48 | 416 | 849 |
| 2001 | 600 | 336 | 283 | 0 | 0 | 0 | 30 | 0 | 90 | 243 | 214 | 302 |
| 2002 | 576 | 789 | 366 | 3 | 0 | 9 | 48 | 126 | 91 | 56 | 292 | 625 |
| 2003 | 1,030 | 716 | 249 | 8 | 12 | 30 | 70 | 0 | 56 | 19 | 314 | 748 |
| 2004 | 1,299 | 820 | 501 | 225 | 280 | 89 | 353 | 311 | 439 | 173 | 335 | 1,285 |
| 2005 | 1,876 | 724 | 1,100 | 219 | 155 | 343 | 600 | 728 | 354 | 204 | 639 | 936 |
| 2006 | 272 | 939 | 326 | 259 | 252 | 926 | 924 | 813 | 138 | 132 | 282 | 759 |
| 2007 | 1,110 | 2,401 | 541 | 543 | 180 | 374 | 430 | 1,695 | 95 | 274 | 830 | 1,379 |
| 2008 | 2,084 | 862 | 800 | 593 | 362 | 999 | 654 | 517 | 604 | 384 | 1,030 | 843 |
| 2009 | 2,195 | 1,527 | 896 | 625 | 305 | 882 | 330 | 258 | 807 | 221 | 327 | 1,375 |
| 2010 | 2,432 | 1,084 | 641 | 295 | 305 | 783 | 1,074 | 522 | 201 | 555 | 773 | 2,912 |
| 2011 | 1,594 | 929 | 557 | 896 | 1,072 | 814 | 1,093 | 545 | 320 | 1,028 | 311 | 757 |
| 2012 | 2,059 | 1,259 | 447 | 1,285 | 944 | 997 | 740 | 959 | 186 | 395 | 871 | 1,264 |
| 2013 | 1,962 | 1,856 | 1,198 | 261 | 441 | 623 | 434 | 844 | 427 | 548 | 1,163 | 1,287 |
| 2014 | 3,539 | 1,600 | 2,015 | 320 | 450 | 675 | 523 | 709 | 268 | 467 | 936 | 1,105 |
| 2015 | 2,600 | 2,807 | 1,060 | 1,025 | 676 | 824 | 1,025 | 498 | 523 | 533 | 451 | 440 |
| 2016 | 2,870 | 1,488 | 788 | 446 | 569 | 639 | 1,014 | 431 | 544 | 278 | 558 | 1,200 |
| 2017 | 1,541 | 1,228 | 1,758 | 412 | 745 | 982 | 1,019 | 237 | 405 | 502 | 302 | 2,047 |
| 2018 | 2,207 | 752 | 2,319 | 1,226 | 645 | 628 | 1,106 | 1,342 | 1,011 | 77 | 1,104 | 1,177 |
| 2019 | 1,857 | 1,225 | 1,342 | 447 | 529 | 508 | 965 | 679 | 490 | 368 | 688 | 1,246 |
| 2020 | 1,241 | 1,451 | 794 | 348 | 508 | 345 | 475 | 364 | 796 | 411 | 381 | 1,946 |
| 2021 | 1,110 | 2,452 | 509 | 421 | 732 | 629 | 465 | 867 | 247 | 596 | 960 | 887 |
| 2022 | 1,836 | 1,144 | 1,059 | 1,117 | 488 | 538 | 570 | 572 | 315 | 326 | 840 | 1,490 |
| 2023 | 664 | 969 | 1,017 | 272 | 382 | 501 | 1,443 | 382 | 500 | 221 | 743 | 1,020 |
| 2024 | 1,835 | |||||||||||
| - = No Data Reported; -- = Not Applicable; NA = Not Available; W = Withheld to avoid disclosure of individual company data. |
| Release Date: 3/29/2024 |
| Next Release Date: 4/30/2024 |