|
Download Data (XLS File) |
|
||||||||
|
||||||||
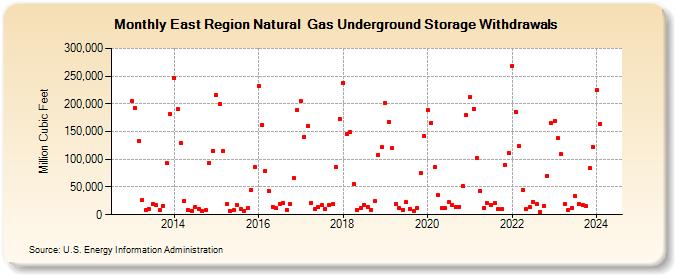
| East Region Natural Gas Underground Storage Withdrawals (Million Cubic Feet) | ||||||||
| Year | Jan | Feb | Mar | Apr | May | Jun | Jul | Aug | Sep | Oct | Nov | Dec |
|---|---|---|---|---|---|---|---|---|---|---|---|---|
| 2013 | 205,329 | 192,162 | 133,394 | 27,394 | 7,768 | 9,648 | 18,856 | 16,972 | 8,426 | 15,331 | 92,696 | 181,860 |
| 2014 | 246,785 | 190,063 | 128,801 | 25,000 | 7,746 | 7,431 | 13,938 | 10,048 | 5,968 | 7,987 | 94,148 | 115,013 |
| 2015 | 215,493 | 200,362 | 114,997 | 18,745 | 6,334 | 8,256 | 18,204 | 9,973 | 7,272 | 12,476 | 44,672 | 85,173 |
| 2016 | 232,512 | 162,611 | 79,363 | 42,708 | 14,758 | 11,660 | 19,397 | 21,152 | 8,650 | 19,587 | 66,153 | 189,152 |
| 2017 | 204,302 | 141,043 | 159,880 | 21,940 | 10,382 | 13,130 | 17,712 | 9,909 | 16,769 | 19,288 | 86,208 | 173,280 |
| 2018 | 238,350 | 145,139 | 148,649 | 55,588 | 8,576 | 12,216 | 18,232 | 14,621 | 9,315 | 24,472 | 108,586 | 121,262 |
| 2019 | 201,772 | 167,407 | 119,815 | 19,321 | 11,241 | 9,281 | 22,195 | 10,575 | 6,738 | 12,543 | 74,528 | 142,269 |
| 2020 | 188,192 | 166,064 | 85,306 | 35,161 | 12,013 | 12,015 | 22,780 | 17,635 | 13,645 | 14,814 | 51,336 | 179,654 |
| 2021 | 212,110 | 191,483 | 101,991 | 42,439 | 12,930 | 21,121 | 18,136 | 21,668 | 10,203 | 10,172 | 89,227 | 111,263 |
| 2022 | 269,138 | 185,995 | 123,880 | 45,210 | 9,489 | 13,355 | 22,994 | 19,807 | 4,158 | 16,458 | 70,703 | 166,287 |
| 2023 | 168,917 | 137,727 | 108,901 | 19,771 | 9,164 | 12,393 | 33,222 | 18,980 | 16,951 | 14,944 | 84,496 | 122,644 |
| 2024 | 224,524 | 164,193 | 92,861 | 24,171 | 9,068 | 14,793 | ||||||
| - = No Data Reported; -- = Not Applicable; NA = Not Available; W = Withheld to avoid disclosure of individual company data. |
| Release Date: 8/30/2024 |
| Next Release Date: 9/30/2024 |