|
Download Data (XLS File) |
|
||||||||
|
||||||||
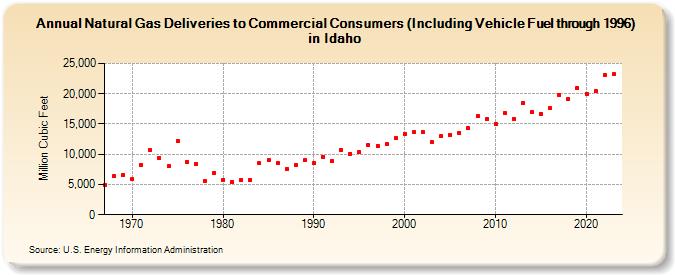
| Natural Gas Deliveries to Commercial Consumers (Including Vehicle Fuel through 1996) in Idaho (Million Cubic Feet) | ||||||||
| Decade | Year-0 | Year-1 | Year-2 | Year-3 | Year-4 | Year-5 | Year-6 | Year-7 | Year-8 | Year-9 |
|---|---|---|---|---|---|---|---|---|---|---|
| 1960's | 4,972 | 6,374 | 6,613 | |||||||
| 1970's | 5,851 | 8,232 | 10,712 | 9,387 | 8,040 | 12,177 | 8,742 | 8,405 | 5,503 | 6,923 |
| 1980's | 5,756 | 5,422 | 5,729 | 5,758 | 8,493 | 8,999 | 8,543 | 7,618 | 8,252 | 9,024 |
| 1990's | 8,535 | 9,582 | 8,932 | 10,675 | 10,088 | 10,360 | 11,506 | 11,433 | 11,676 | 12,618 |
| 2000's | 13,414 | 13,623 | 13,592 | 12,019 | 12,995 | 13,231 | 13,573 | 14,274 | 16,333 | 15,740 |
| 2010's | 15,033 | 16,855 | 15,838 | 18,485 | 16,963 | 16,708 | 17,598 | 19,777 | 19,113 | 20,971 |
| 2020's | 20,001 | 20,386 | 23,158 | 23,193 |
| - = No Data Reported; -- = Not Applicable; NA = Not Available; W = Withheld to avoid disclosure of individual company data. |
| Release Date: 8/30/2024 |
| Next Release Date: 9/30/2024 |