A crack spread measures the difference between the purchase price of crude oil and the selling price of finished products, such as gasoline and distillate fuel, that a refinery produces from the crude oil. Crack spreads are an indicator of the short-term profit margin of oil refineries because they compare the cost of the crude oil inputs to the wholesale, or spot, prices of the outputs (although they do not include other variable costs or any fixed costs). The 3:2:1 crack spread approximates the product yield at a typical U.S. refinery: for every three barrels of crude oil the refinery processes, it makes two barrels of gasoline and one barrel of distillate fuel.
To calculate the 3:2:1 crack spread for a Gulf Coast refinery that processes Louisiana Light Sweet (LLS) crude oil, add the spot price for two barrels of Gulf Coast conventional gasoline to the spot price for one barrel of Gulf Coast ultra-low sulfur diesel. Since prices for petroleum products are typically quoted in dollars per gallon, they must be multiplied by 42 gallons per barrel to convert to dollars per barrel. Then subtract the spot price for three barrels of LLS crude oil. Finally, divide the result by 3 to produce a crack spread in dollars per barrel.
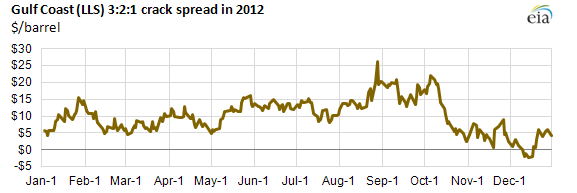
The figure illustrates the Gulf Coast (LLS) 3:2:1 crack spread during 2012. Because the 3:2:1 crack spread is a product of the interplay of three commodity prices, each subject to different but interconnected supply and demand balances, the range of values can vary widely. Product supply shortages resulting from serious disruptions such as hurricanes or other refinery or pipeline outages can cause large spikes of short duration.