DOE provides detailed onshore wind resource map
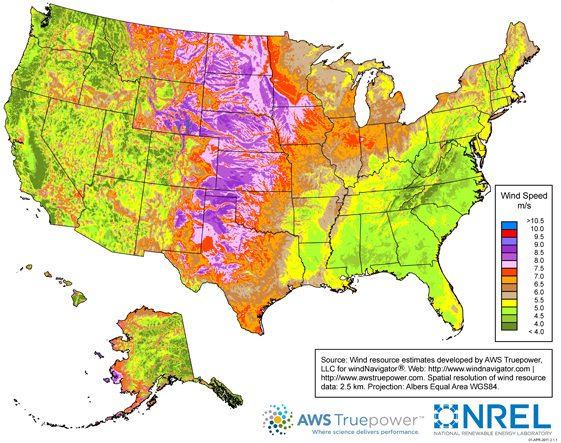
U.S. annual average wind speed at 80 meters
Note: Click on a state to view the wind map for that state. Puerto Rico and the U.S. Virgin Islands do not have 80-meter wind maps available but have 50-meter wind maps.
Wind Powering America (a DOE program initiative) publishes an onshore wind resource map for the United States, at 80 meters above ground and with resolution down to 2.5 meters. This map was updated in March 2010, the first comprehensive update of U.S. wind energy potential since 1993.
The 2010 update to the wind resource map raised the height at which the measurements were taken from 50 to 80 meters above ground, addressing updates in turbine technology and showing an increase in the total wind capacity resource of the continental United States.
Areas with annual average wind speeds around 6.5 meters per second or greater, and at 80 meters above the ground, are generally considered to have suitable wind resource for wind development (orange, red, and purple on the map above). Utility-scale wind turbine towers range in height from 60 to 120 meters; 18-60 meter turbines can be used for community- or residential-scale electricity generation.
Much of the high-potential onshore wind resources are located in low-population-density areas (i.e., the Great Plains). Many recent transmission investments, as well as proposed transmission projects, focus on delivering electricity generated from wind power to load centers where there is strong electricity demand.
Factors other than wind resource availability will likely play a dominant role in determining how much of the wind resource illustrated in the map will ultimately be developed. A slow rate of projected electricity demand growth limits the amount of new generating capacity that is needed. At the same time, the economic competitiveness of wind generation is sensitive to the future availability of incentives, such as the project tax credit, and to the cost of natural gas and other competing technologies.
The siting of transmission lines needed to move wind power from high-resource areas to major load centers and the allocation of costs for new transmission capacity are also significant issues under consideration by the Administration, the Federal Energy Regulatory Commission, and the States. On the other hand, capacity retirements and Renewable Portfolio Standards at the State level may work to spur growth in wind capacity.
A large pdf of the U.S. map and individual State maps are available at the Wind Powering America website.
Tags: electricity, map, renewables, resources, wind