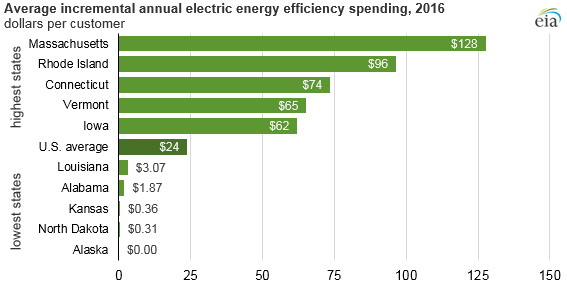
State efficiency incentives averaged $24 per customer, ranged from $0 to $128 in 2016
U.S. electric utilities reported spending $3.6 billion on energy efficiency customer incentives in 2016, or an average of $24 per customer, according to EIA’s survey of electric power sales, revenue, and energy efficiency (EIA-861). Energy efficiency spending is reported on an incremental basis, reflecting new programs operating for the first time in 2016 (including start-up costs) or new participants in existing programs.
Most reported spending supported residential and commercial energy efficiency: 43% of spending targeted residential customers, and 49% targeted commercial customers. The remaining 8% of spending targeted industrial customers. Average reported spending per customer varied by state, from $0 in Alaska to $128 in Massachusetts. High-spending states and low-spending states tend to be concentrated in particular regions. By U.S. census region, average utility spending ranged from $11 per customer in the South to $47 per customer in the Northeast. Spending also was higher in certain states with high electricity prices, such as Hawaii, or in certain states with climates that require more energy for heating and cooling, such as Illinois and Arizona.
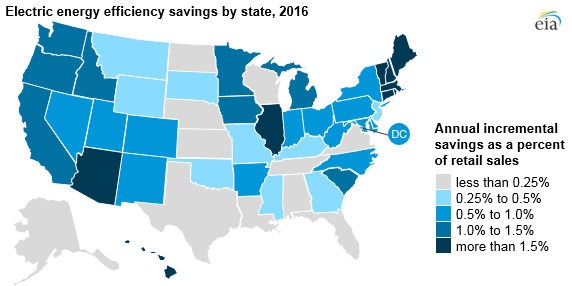
Incremental savings as a result of energy efficiency spending for reporting year 2016 totaled 27.5 billion kilowatthours, or 0.7% of nationwide retail electricity sales. Projected lifecycle savings were much greater, at 354 billion kilowatthours over the lifetime of the efficiency measures used, because some measures that affect heating, cooling, and water heating equipment can provide benefits for several years. Like spending, most savings occurred in the residential and commercial sectors.
Annual incremental savings also varied by state, from near 0% of electricity retail sales in Kansas and Alaska to 3% of retail sales in Massachusetts and Rhode Island. Average electricity savings by U.S. census region was the highest at 1.2% in the Northeast, and the lowest at less than 0.4% in the south.
Utility energy efficiency incentives can be financial, such as subsidies and rebates for energy efficient equipment, or educational, such as technical assistance, audits, or home energy scores. Behavioral energy efficiency programs, such as home energy use reports, employ messaging to alter consumer behavior. Incentives can be offered to building owners, building occupants, contractors, or upstream or mid-stream retailers, among others.
Support for efficient lighting options such as light-emitting diodes (LED) has produced a large portion of utility energy efficiency savings to date, according to program administrators and regulators such as the California Public Utilities Commission, ISO New England, Efficiency Vermont, Rocky Mountain Power, and the Massachusetts Energy Efficiency Advisory Council.
According to the U.S. Environmental Protection Agency’s ENERGY STAR® program, utility subsidies for LED bulbs across the United States typically ranged from $1 to $15 per bulb in 2016. Utility programs also subsidize purchases of energy-efficient heating, ventilation, and air-conditioning equipment; encourage adoption of learning thermostats; or offer whole-building retrofits or upstream programs—programs that offer incentives to manufacturers and distributors that are passed on to customers—according to a 2017 report by the American Council for an Energy-Efficient Economy.
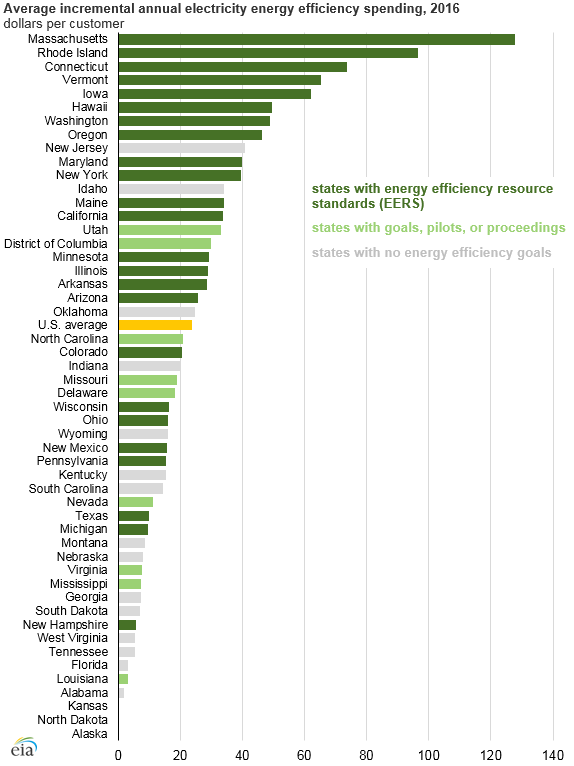
Utilities administer energy efficiency programs alongside a variety of other federal, state, and local energy efficiency requirements and incentives. Federal regulations and initiatives include minimum federal appliance efficiency standards and the voluntary ENERGY STAR program, while state initiatives range from mandatory energy efficiency resource standards (EERS) to non-binding goals and pilot programs.
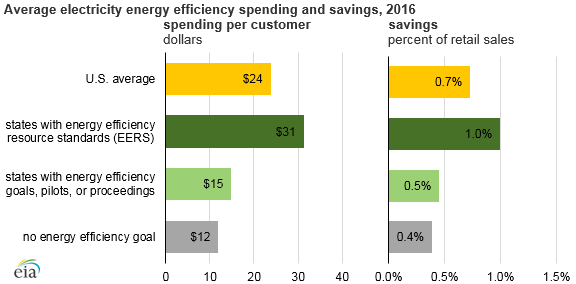
EERS-related policies have become an indicator of states with a higher commitment to ongoing energy efficiency actions. Utilities in states with an EERS tend to report significantly more spending and savings than utilities in states with non-binding goals or no programs at all.
In states with an EERS, utilities spent $31 on incentives per customer and saved 1.0% of retail electricity sales on average in 2016. In comparison, utilities in states with non-binding goals or pilot programs spent an average of $15 per customer and saved 0.5% of retail sales, and utilities in states with no energy efficiency goals spent $12 per customer and saved 0.4% of retail sales.
Note: Click to enlarge.
Principal contributors: Meera Fickling
Tags: states, efficiency, electricity