In 2017, U.S. electricity sales fell by the greatest amount since the recession
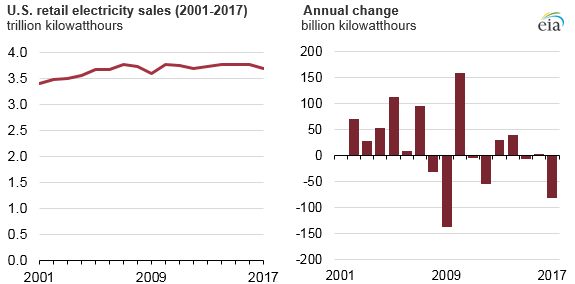
U.S. retail electricity sales fell by 80 billion kilowatthours (kWh) in 2017, the largest drop since the economic recession in 2009. The 2% decrease in 2017 reflects lower retail sales in the residential, commercial, and industrial sectors and is largely attributable to milder weather. Total electricity retail sales in 2017 were 3,682 billion kWh, nearly identical to the levels seen more than a decade before, in 2006.
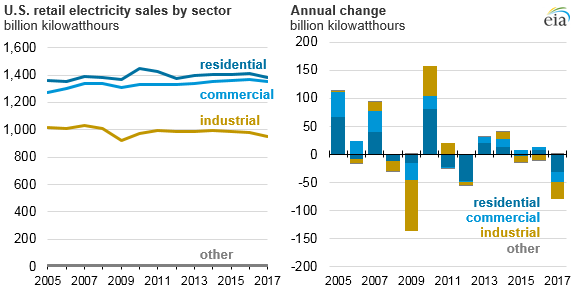
The residential sector buys the most electricity from the grid, accounting for slightly more than 37% of the 2017 total. Commercial sector electricity retail sales made up slightly less than 37% of the total in 2017, and the industrial sector made up about 26%.
Although factors such as electricity prices, energy efficiency, and macroeconomic cycles play a role in the use of electricity in each sector, most of the year-over-year changes in sales in 2017 were attributable to changes in weather. With few exceptions, air conditioning and other cooling equipment is powered by electricity, so warmer weather in summer months often results in greater use of air conditioning and higher retail electricity sales. Cooling degree days, an indicator of cooling-related energy demand, were 9% lower in 2017 compared with 2016 levels, indicating a cooler summer in 2017 and less demand for air conditioning.
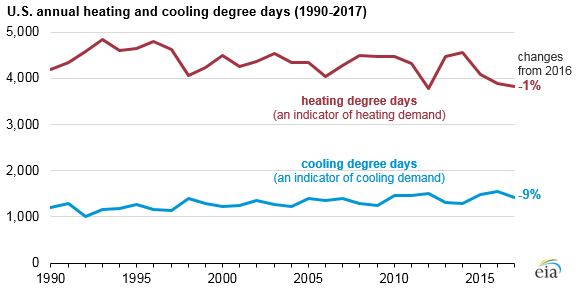
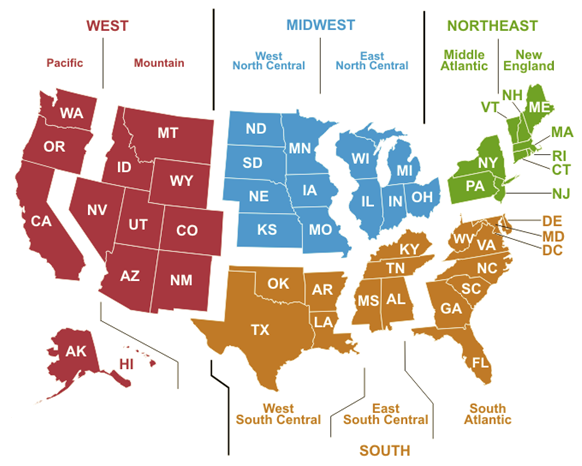
Although fuels other than electricity such as natural gas, heating oil, and propane can be used to generate heat, electricity use also increases in colder weather. Heating degree days, an indicator of heating-related energy demand, were 1% lower in 2017 compared with 2016 levels. In the South census region, where homes and businesses are more likely to heat with electricity, 2017 heating degree days were 8% to 10% lower than in 2016.
More data about retail sales of electricity are available in EIA’s Electric Power Monthly.
Principal contributor: Owen Comstock