Working natural gas storage capacity grows 3% year-over-year
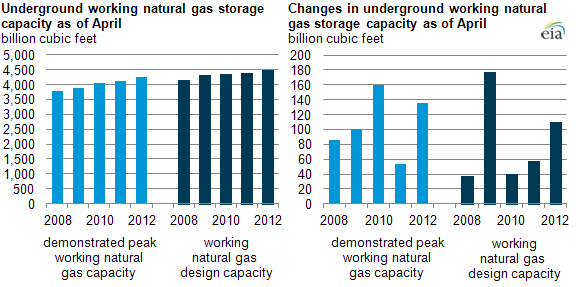
EIA estimates that the demonstrated peak working gas capacity for underground storage in the lower 48 states rose 3%, or 136 billion cubic feet (Bcf), to 4,239 Bcf in 2012 compared with 2011. EIA's report compares data from April to April; since April 2012, EIA analysts said 7.5 Bcf has been added to working gas storage capacity cited in the report, and they estimated that another 32 Bcf could potentially be added by year-end.
Demonstrated peak capacity is the aggregate peaks for a rolling five-year period of what storage operators actually put in the ground. It differs from design, or engineered, capacity (a larger volume), which is what the nation's storage facilities could physically hold. The demonstrated peak volume is what typically is considered a proxy for full storage.
The report data are as of April in each year. Since April 2012, however, another 7.5 Bcf has been added to working gas storage capacity, and EIA analysts believe from anecdotal information that there is the potential for another 32 Bcf to be in operation by year-end.
In the formal report, most of the 136-Bcf increase in demonstrated peak capacity for April 2012 over April 2011 came in the form of more use of traditional storage in the West (56 Bcf) and salt cavern storage in the Producing region (58 Bcf). Salt cavern storage allows rapid injection and withdrawal to respond to market conditions and other short-term events. Demonstrated peak working natural gas in the East rose by only 14 Bcf (less than 1%), but this small increase coincided with the rapid growth of production from the Marcellus Shale in Pennsylvania.
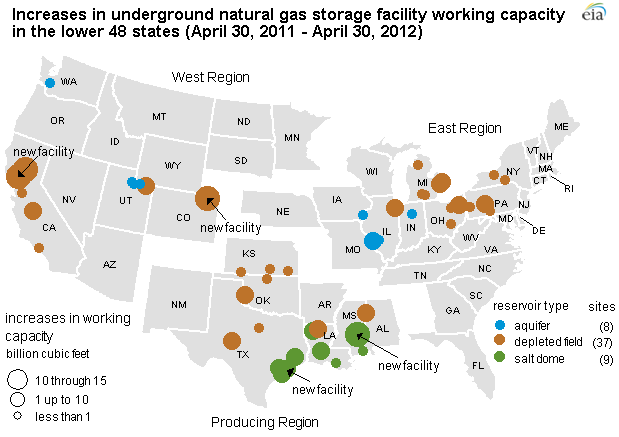
Note: Locations of storage facilities presented in the map are approximate. Some symbols representing storage facilities may overlap. The map excludes decreases in capacity.
The significance of this report is that it shows the growing role of natural gas in the U.S. energy economy. In a page from Field of Dreams, storage operators built more storage capacity and storage holders came up with even greater volumes to put into storage. Concerns expressed early this year that there might not be enough capacity to hold the storage overhang following the warm winter plus normal summer injections should be alleviated by EIA's assessment that there is nearly 4,500 Bcf of physical storage capacity for the gas market.
Working gas design capacity increased 110 Bcf in the lower 48 states between April 2011 and April 2012. The largest increases by volume occurred in the Producing region, where design capacity increased 52 Bcf (4%). Capacity additions in the West region posted relatively larger year-on-year increases, rising 48 Bcf (nearly 7%).
Those increases in design capacity since April 2011 resulted from the completion of four new storage facilities in addition to approximately 50 expansion projects. The four new facilities accounted for nearly 38 Bcf of the year-on-year increase in design capacity, and the remaining 72-Bcf increase was provided by expansion projects. In the West, two new facilities provided 23 Bcf, with expansions of existing facilities adding 26 Bcf.
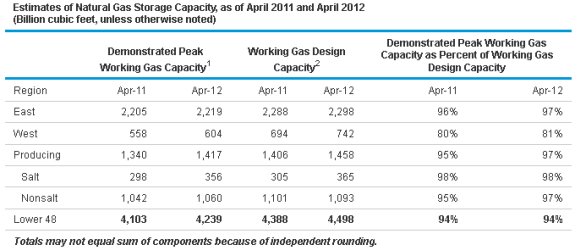
Note: 1) 'Demonstrated Peak Working Gas Capacity' is the sum of the highest storage inventory level of working gas observed in each facility over the prior 5-year period as reported by the operator on the Form EIA-191M, Monthly Underground Gas Storage Report. The timing for peaks for different facilities need not coincide. 2) 'Working Gas Design Capacity' is an estimate of a natural gas facility's working gas capacity, as reported by the operator on the Form EIA-191A Annual Underground Gas Storage Report, and represents the sum of the result across all fields. It is a measure based on the physical characteristics of the reservoir, installed equipment, and operating procedures particular to the site that is often certified by Federal or State regulators. Information for all facilities, including inactive fields is available at: http://www.eia.gov/cfapps/ngqs/ngqs.cfm?f_report=RP7
R - Revised
Information about storage regions is available at Storage Basics.
Demonstrated peak working gas capacity increased as a percentage of design capacity in each of the regions year-over-year, meaning that growth in capacity utilization outstripped growth in capacity. This dynamic resulted in the 2012 demonstrated peak capacity in the Producing region exceeding the design capacity reported the previous year as robust storage volumes found a home in the newly available physical capacity.
Demonstrated peak capacity as a percentage of design capacity is lower in the West than the East and Producing regions for several reasons. The West has several still-active fields whose primary role is not seasonal storage. These include fields used for pipeline load balancing and fields that are being drawn down to be taken out of service. Also, some fields in the West have large design capacities, but have infrastructure constraints such as limited pipeline and compression capacity that limit actual storage use and peak capacity.
The status of several previously inactive storage fields changed since April 2011. This has had differing effects on working gas design capacity. The Pecan Station storage field in Texas resumed operations in 2012, contributing about 1 Bcf to the year-on-year increase in design capacity. Two other previously inactive storage facilities were removed from the Natural Gas Annual Respondent Query System for 2012 because they are no longer being operated as gas storage facilities. The remaining base and native gas volumes in Brown's Creek and Lake facilities, both in West Virginia, are being withdrawn and, thus, reported as natural gas production. The removal of these fields from the query system does not affect working gas design capacity or peak storage estimates in 2011 or 2012.
The Peak Underground Working Natural Gas Storage Capacity Report provides access to an interactive query system that enables analysts to search for storage facilities by various criteria.
Tags: capacity, map, natural gas, storage, storage