U.S. summer gasoline demand expected to be at 11-year low
Note: The 2012 figures for summer gasoline demand and retail gasoline prices are projections from EIA's Short-Term Energy Outlook. Data and projections from STEO are subject to change with the next release of the STEO on May 8, 2012.
Download CSV Data
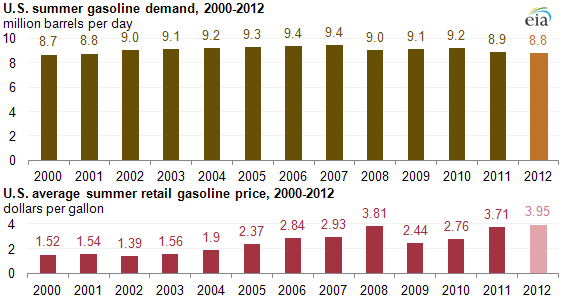
U.S. gasoline demand this summer is expected to be the lowest in 11 years, while the average summer fuel price is forecast to be at a record level. High prices at the pump—mostly a result of global crude oil prices—and the use of more efficient vehicles both encourage reduced gasoline consumption.
U.S. gasoline consumption is forecast to average almost 8.8 million barrels per day (bbl/d) this summer driving season, which runs from April through September, the lowest since 2001 and about 6.4% less than 2007's record summer gasoline demand of 9.4 million bbl/d (see chart above), according to EIA's April 10, 2012 Short-Term Energy Outlook (STEO). Data and projections from STEO are subject to change with the next release of the STEO on May 8, 2012.
Also, higher vehicle fuel efficiency should contribute to lower gasoline demand this summer. Higher gasoline prices, which are expected to be up an average of 24 cents per gallon this summer compared to last year, according to the April 2012 STEO, are also expected to reduce some highway travel, which will reduce fuel use.
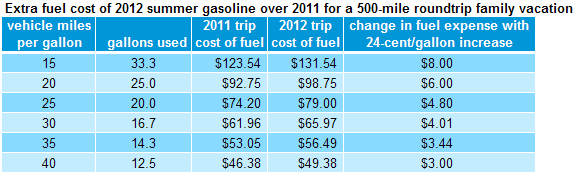
While retail gasoline prices are forecast to be higher this summer than last summer, the cost to fill up the family vehicle for a vacation trip will rise modestly. For example, in a vehicle that gets 20 miles per gallon, a vacation covering 500 miles roundtrip uses 25 gallons of motor fuel and costs an extra $6 in fuel, based on EIA's April 2012 STEO forecast of a 24-cent average higher price for gasoline this summer. The extra gasoline expense would vary depending on the fuel efficiency of the vehicle (see table below).
Note: Data and projections from STEO are subject to change with the next release of the STEO on May 8, 2012.
Download CSV Data