Energy commodity prices increased in the second half of 2017
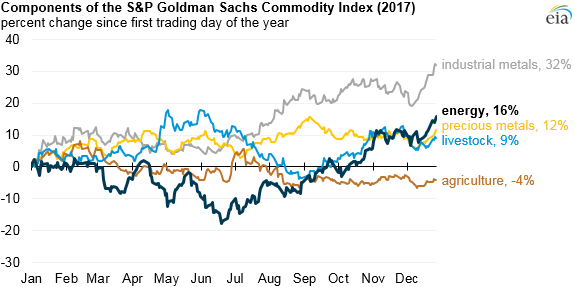
Note: S&P GSCI indices shown in the chart are spot return indices, which only reflect levels of futures contracts included in the index.
After decreasing nearly 20% in the first half of 2017, the spot energy index in the Standard and Poor's (S&P) Goldman Sachs Commodity Index (GSCI) ended 2017 16% higher than the beginning of the year. Higher crude oil and petroleum product prices in the second half of 2017 were responsible for the increase in the S&P GSCI energy index.
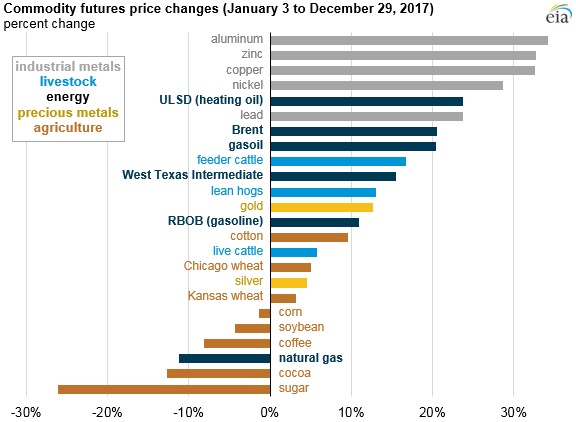
Note: Price changes reflect changes in front month futures contract price for each commodity. RBOB is reformulated gasoline blendstock for oxygenate blending, and ULSD is ultra-low sulfur diesel.
West Texas Intermediate (WTI) and Brent, two major crude oil benchmarks, account for 70% of the weighting in the S&P GSCI energy index. As a result, the energy index tends to follow major price movements in the crude oil market. The weights associated with individual commodities within the S&P GSCI index are updated every year in response to changes in global commodity production quantities and futures contract trading volumes.
Although still lower than in 2011 through 2014, crude oil prices rose for the second straight year after a crude oil production-cut agreement was executed among the Organization of the Petroleum Exporting Countries (OPEC) and some non-OPEC countries, which partially constrained global crude oil production. The agreement came into effect in January 2017 and will continue through the end of 2018. In addition to supply-side factors, strong economic growth in both developed and emerging markets has led to higher oil demand.
Petroleum-based products such as reformulated gasoline blendstock for oxygenate blending (RBOB), ultra-low sulfur diesel (ULSD), and gasoil together accounted for 24% of the S&P GSCI energy index. ULSD had the largest price increase among energy commodities. Increased global trade and accelerating global manufacturing activity have resulted in relatively high global distillate consumption.
Gasoline prices did not increase as much as distillate and crude oil prices. U.S. gasoline consumption growth slowed from 2016 to 2017, compared with the prior two years when sharp declines in gasoline prices, among other factors, contributed to strong gasoline consumption growth.
Natural gas accounts for the remaining 6% of the S&P GSCI energy index and is the only energy commodity price that declined in 2017. After ending 2016 at the highest point in two years, Henry Hub natural gas prices dropped in the first few months of 2017 because of warmer weather and higher-than-average inventory levels at the end of the winter heating season. Natural gas prices then stayed relatively flat for most of the second half of 2017. Less natural gas was used in U.S. electricity generation during the summer of 2017 compared with 2016. However, U.S. exports of natural gas reached a record high in 2017, with Mexico as the largest recipient.
The spot S&P GSCI industrial metals index rose the most among all the S&P GSCI indices, increasing 32% in 2017, with aluminum, zinc, and copper having the largest price increases. The S&P GSCI precious metals and livestock indices rose 12% and 9%, respectively, while the spot S&P GSCI agriculture index declined 4%, led by declines in sugar and cocoa prices.
Principal contributor: Rebecca George
Tags: diesel, gasoline, liquid fuels, natural gas, oil/petroleum, prices