EIA reviews and enhances data and projections for wind and solar electricity
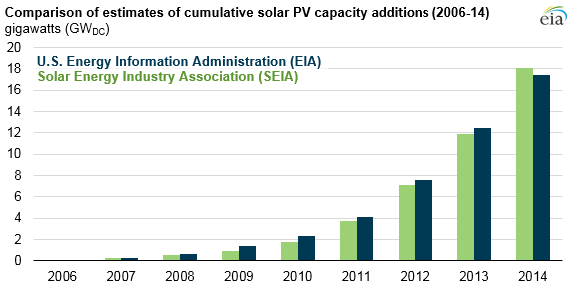
Note: Direct current to alternating current ratio of 1.25 was assumed for utility-scale PV capacity to reflect inverter sizing and losses.
EIA's data and projections for renewable electricity, in particular wind and solar generators, are a major topic of interest for many EIA customers. In an effort to assure that data are accurate and comprehensive, and that projections are useful for policy analysis, EIA regularly reviews its data and projections, as well as current and projected costs for wind and solar technologies.
Each edition of EIA's Annual Energy Outlook (AEO) since 2006 provides current estimates and future projections of both utility-scale and distributed generation units located at end-use customer sites (i.e., those on residential and commercial rooftops). As shown in the graphic above, EIA's current estimates for total solar PV capacity (utility-scale and distributed) in recent AEOs closely correspond to those reported by industry sources such as the Solar Energy Industry Association (SEIA). Industry sources do not generally provide generation estimates.
While distributed solar PV data have been reported in the AEO for many years, until recently EIA's Electric Power Monthly (EPM) included data only for utility-scale generation sites with capacities of at least one megawatt, reflecting the coverage of EIA's monthly surveys of electric generators. However, beginning with the November 2015 Electric Power Monthly, EIA now includes data on capacity and generation of distributed solar PV units in addition to data for utility-scale systems. Data reported in the EPM include both generation and capacity by state and sector.
Turning to projections, some critics have argued that EIA's recent AEO Reference case projections have consistently understated the adoption of wind and solar power. A review of past performance of EIA's projections does not offer much support for this argument, particularly when it is recognized that AEO Reference case projections deliberately incorporate existing laws and regulations that are in effect at the time the Reference case projections are developed and do not attempt to forecast future policy decisions.
This is of particular importance for wind and solar, where policies and policy changes have had a very significant influence on realized outcomes. EIA's approach enables the Reference case to serve as a point of comparison for policymakers to evaluate the impact of policy proposals, including the extension of policies that are already in effect but are scheduled to expire under current law, against the alternative of leaving current laws and regulations unchanged. Because renewable energy policies at both the federal and state level have frequently changed over the past decade, the policies in place when the projections were made have typically not matched the policies in place just a few years later.
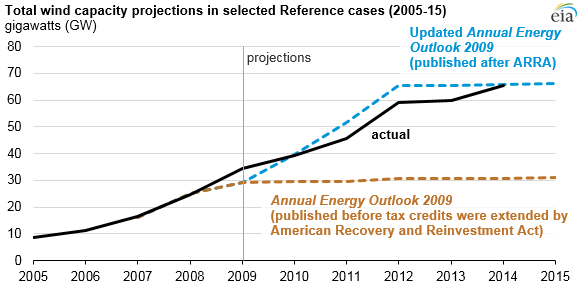
For example, one widely circulated portrayal of EIA's renewable energy projections noted that the AEO Reference case, published in December 2008, projected that utility-scale wind capacity would grow to 44 gigawatts (GW) by 2014. Six years later, actual wind capacity in 2014 was 66 GW. However, that report omitted crucial context, as the projection it cited was published just prior to the passage of the American Recovery and Reinvestment Act (ARRA 2009), which was signed into law in February 2009 and included, among other things, a four-year extension of tax credits affecting wind turbines. In April 2009, EIA published an updated AEO that reflected the change in policy and projected wind capacity to grow to 66 GW by 2014, nearly identical to the actual outcome.
As another example, the wind tax credit has been allowed to expire and then been re-enacted (with some significant modifications) three times since the ARRA extension. Most recently, the wind tax credit extension in December 2015, as part of the Consolidated Appropriations Act for fiscal year 2016, extended the 30% investment tax credit for solar technologies that was previously scheduled to expire at the end of 2016. The first two post-ARRA tax credit extensions helped spur additional wind growth in 2015. The latest extension, which will be reflected in AEO2016 and subsequent AEOs along with other new laws and final regulations affecting the electricity sector, will likely also spur wind growth in the future.
Turning to the costs of wind and solar technologies, EIA each year reviews a variety of sources for technology costs as it seeks to align its cost assumptions with fast-changing markets. EIA's costs are typically within ranges suggested by these sources and generally track trends seen in leading cost analyses. EIA recently reviewed technology costs to be used in AEO2016 through a process that includes workshop discussions involving stakeholders. Based on that review, EIA expects to incorporate significant adjustments to the wind and solar costs used in AEO2015.
EIA, like many others who follow renewable costs, did not anticipate the sharp decline in solar PV costs seen over the past several years, but the agency has worked to keep baseline cost assumptions current as costs have declined. While sensitivity analyses with lower costs have the expected directional effect on renewables' future share in the generation mix in EIA's projections, policies toward new renewables and existing fossil generation remain a dominant driver of projected market penetration over the next decade.
EIA continues to work with industry stakeholders to ensure its assumptions and analytic methodologies provide accurate data and appropriate projections for wind, solar, and other renewables. A more extensive review of EIA's data and projections for wind and solar technologies is available in a recent EIA report, Wind and Solar Data and Projections from the U.S. Energy Information Administration: Past Performance and Ongoing Enhancements.
Principal contributors: Chris Namovicz