Utility-scale solar in South Atlantic region dominated by North Carolina, Georgia
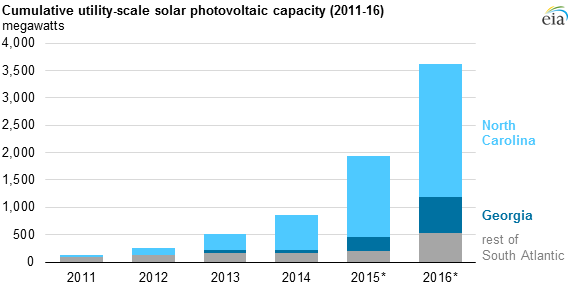
Note: Capacities for October-December 2015 and all of 2016 reflect reported planned additions.
Most of the utility-scale solar photovoltaic (PV) electric generating capacity has been installed in the southwestern part of the country in states such as California and Arizona, which together accounted for 64% of the national total as of September 2015. The South Atlantic region currently has about 11% of the nation's 9,968 megawatts (MW) of utility-scale PV capacity, largely in North Carolina. Until now, Georgia has installed relatively little solar PV capacity, but the state plans to add more than 600 MW of utility-scale solar by the end of 2016.
Unlike the distributed generation often installed on rooftops, the utility-scale systems discussed here each have a generating capacity of one MW or greater. In 2014, North Carolina was second only to California in terms of utility-scale PV additions. Based on reported and planned installations for 2015, North Carolina will likely remain in second place. The top five states in terms of expected utility-scale PV additions in 2015—California, North Carolina, Nevada, Georgia, and Utah—account for more than 80% of the nearly 3,000 MW of utility-scale solar PV expected to be added in the United States during 2015.
Although they are at similar latitudes, the states in the Southern Atlantic region have lower-quality solar resources than areas in Southern California, Arizona, Nevada, and New Mexico, which have some of the best solar resources in the world. In addition to latitude, solar resource quality depends on levels of direct sunlight and diffuse sunlight, both being affected by cloud cover, humidity, and trace gases.
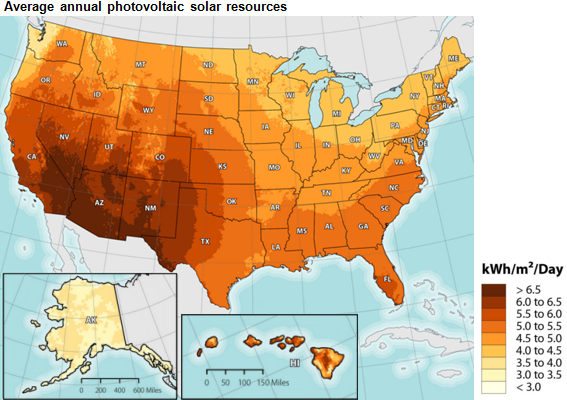
Note: Average annual solar resources are shown for a collector tilted at latitude. kWh denotes kilowatthours, m2 is square meters.
Georgia plans to construct thirteen solar PV projects totaling 607 MW with expected in-service dates of 2015 or 2016. Five of these new projects (totaling 166 MW) will be built on U.S. military bases as a result of a memorandum of understanding (MOU) between the Georgia Public Service Commission (PSC), Georgia Power Company, and the U.S. Department of Defense. Georgia Power, a subsidiary of the Southern Company, will own and operate these plants, which have an expected 35-year life. Most of Georgia's utility-scale solar PV, both operating and planned, will be sold under long-term (20- to 30-year) contracts known as power-purchase agreements (PPA). When announcing the decision to install five solar projects on military bases, the Georgia PSC noted it could authorize the installations because the cost to install solar had fallen enough to meet the state's avoided cost requirement, which tests whether new generating capacity would cause customer rates to increase.
Unlike North Carolina, Georgia has no renewable portfolio standard (RPS)—a policy that requires a certain level or percentage of electricity generation from renewable sources. Many other states with strong solar growth have such policies. For instance, North Carolina requires 12.5% of its electricity to be generated from renewable sources by 2021, with a special provision that solar PV and/or distributed generation sources account for at least 0.2% of the state's electricity generation by 2018.
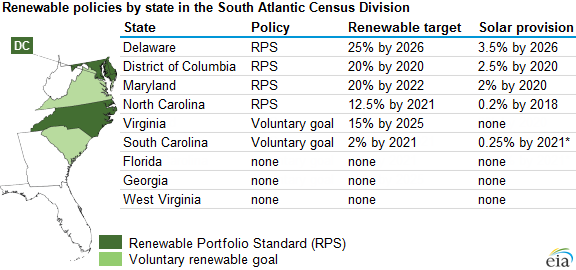
Note: South Carolina's solar provision specifies distributed generation solar.
This month, EIA began reporting state-level data for distributed solar PV capacity (less than 1 MW) and generation, along with its monthly reporting of utility-scale data in the Electric Power Monthly. As of September 2015, the South Atlantic region had 505 MW of distributed solar PV, accounting for 32% of the region's total estimated solar capacity. In North Carolina and Georgia, utility-scale PV makes up most of installed solar capacity, with distributed generation providing 7% and 43%, respectively, of the total installed solar capacity in those states.
Principal contributor: Carol Brotman White
Tags: electricity, generating capacity, map, solar, states