EIA expects near-term decline in natural gas production in major shale regions
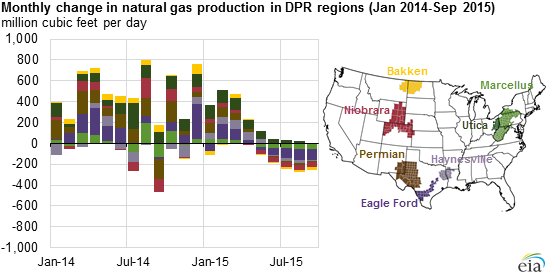
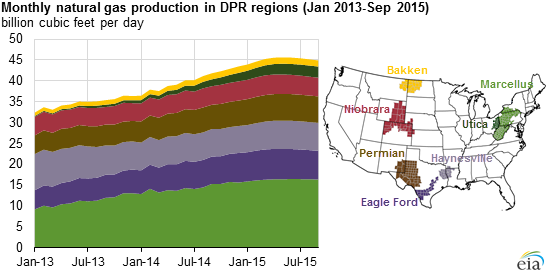
Natural gas production across all major shale regions in EIA's Drilling Productivity Report (DPR) is projected to decrease for the first time in September. Production from these seven shale regions reached a high in May at 45.6 billion cubic feet per day (Bcf/d) and is expected to decline to 44.9 Bcf/d in September. In each region, production from new wells is not large enough to offset production declines from existing, legacy wells.
The DPR provides a month-ahead forecast of natural gas and crude oil production for the seven most significant shale formations in the United States. In order to estimate total natural gas production within a DPR region in a given month, production from both new wells and legacy wells must be taken into account. New-well production is estimated by multiplying estimated rig productivity by the number of rigs operating in the region, lagged by two months. Production from new wells is then compared to the anticipated production declines from legacy wells, which are typically based on well depletion rates, to estimate net production.
In any given month, new-well production depends on the number of drilling rigs and the productivity of those rigs and the wells added through their use. As rig counts fall, increases in rig productivity are necessary not only to compensate for the reduced rig total, but also for rising levels of legacy-well declines. Given the substantial drop in rig counts since the fourth quarter of 2014 in each of the DPR regions and growing declines in production from legacy wells, productivity increases are less able to completely offset lower rig counts and legacy-well declines.
The Utica region in eastern Ohio is the only DPR region expected to show production increases in June, July, and August. Production declines from legacy wells in the Utica are estimated to total 55.6 million cubic feet per day (MMcf/d) in September. Partially countering this decline is expected production from new wells of 52.2 MMcf/d in September. New-well natural gas production per rig is estimated to be about 7 MMcf/d, an increase of 47% from September 2014. Seven rigs were drilling in the Utica in July (the most recent data available). Multiplying the seven rigs by the estimated new-well gas production per rig yields the total new-well production estimate for September. Because this value is lower than the decline from legacy wells, total production is expected to fall by 3.4 MMcf/d.
A year ago, the higher number of rigs operating in the Utica meant that new-well production more than offset the 26.5 MMcf/d in legacy-well declines, resulting in a net production increase of 116.5 MMcf/d. Since then, falling rig counts and increasing legacy-well declines mean the increase in Utica new-well productivity is insufficient to overcome legacy-well production declines.
Several external factors could affect the estimates, such as bad weather, shut-ins based on environmental or economic issues, variations in the quality and frequency of state production data, and infrastructure constraints. These factors are not accounted for in the DPR. For example, on August 1, the Rockies Express Pipeline started to deliver 1.8 Bcf/d of Appalachian natural gas production west on its existing mainline as part of the Zone 3 East-to-West Project. This increase in takeaway capacity may encourage increased production from regions such as the Marcellus and Utica.
The DPR provides a very near-term forecast in specific plays based on the most current information. Longer term outlooks that include play-level detail, such as the Annual Energy Outlook, reflect resource and technology assumptions and projected prices and often move in different directions than the DPR, which reflects short-term factors.
Principal contributor: Grant Nülle
Tags: natural gas, production/supply, shale