Household spending on gasoline and public transit varies by region, income
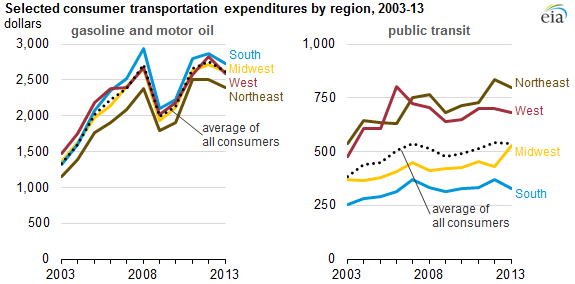
Households in different regions of the United States have similar average combined spending on gasoline and public transit, but the composition of that spending varies significantly across regions. In 2013, the most recent year of data from the U.S. Bureau of Labor Statistics' Consumer Expenditure Survey (CES), the average household spent $3,148 annually on gasoline and public transit, with only about a $200 difference between geographic regions with the highest and lowest travel expenditures. Differences across income levels are much greater, as households in the highest-income brackets spent almost four times as much on recurring travel expenditures as those in the lowest-income bracket.
Regional differences in gasoline expenditures are almost the reverse of regional spending on public transit. The South, which stretches along the Atlantic Coast from Delaware to Florida, and west to Texas and Oklahoma, tends to spend more than any other region on gasoline each year. On the other hand, the South spends the least on public transit. In the Northeast, the reverse is true: the region spends the most on public transit, but the least on gasoline. Higher expenditures on gasoline tend to reflect the number of vehicles per household, as households in the South have an average of 2.1 vehicles per household (slightly more than the national average of 1.9), while households in the Northeast average 1.6 vehicles.
In terms of public transportation ridership, the Northeast is home to several of the largest mass transit and light rail systems in the United States (for example, the New York City Subway and the Massachusetts Bay Transit Authority systems), as well as extensive commuter railroad networks. Only a few cities in the South (such as Washington, DC, Atlanta, Miami, and Baltimore) have rapid transit systems that serve at least 10 million riders annually. Expenditures for public transit also include fares from other forms of transit, such as buses.
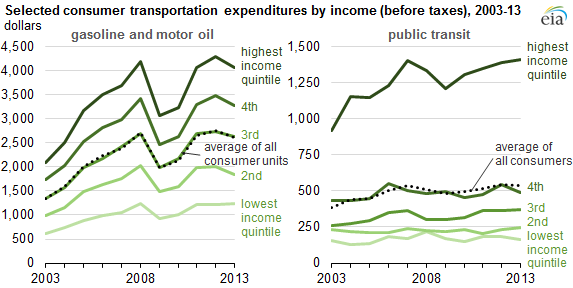
Travel-related expenditures tend to vary directly with household income levels. To measure differences across income levels, the CES splits households (technically, consumer units) into five equally sized groups. The highest income quintile (making at least $95,000 per year) spent slightly more than $4,000 on gasoline in 2013, while the lowest income quintile (making under $18,000 per year) spent about $1,200 on gasoline. Higher-income households also have more vehicles: 2.8 per household for the highest quintile compared with 0.9 per household for the lowest quintile.
Public transit expenditures vary even more by income levels. Households in the highest-income quintile spent more than $1,400 on public transit in 2013, almost three times the national average ($537) and more than eight times that of the lowest-income quintile ($163).
Annual changes in expenditures reflect both consumption and prices. With relatively little change in consumption, gasoline expenditures tend to track gasoline prices (and therefore crude oil prices), while public transit expenditures, which reflect ridership and fares, tend to fluctuate much less year to year.
Principal contributors: Owen Comstock, Trisha Hutchins
Tags: gasoline, prices, residential, states, transportation