Total energy subsidies decline since 2010, with changes in support across fuel types
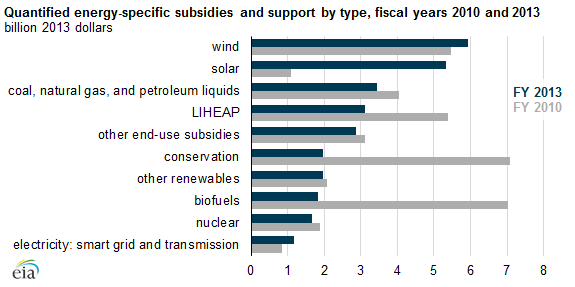
Note: LIHEAP is the Low Income Home Energy Assistance Program.
EIA has updated a report on federal subsidies to the energy industry, covering the 2013 fiscal year (FY). The most recent prior report reviewed subsidies in FY 2010, at or near the height of spending related to the American Recovery and Reinvestment Act of 2009 (more commonly known as the Recovery Act). Between FY 2010 and FY 2013, the total value of direct federal financial interventions and subsidies in energy markets decreased 23% from $38.0 billion to $29.3 billion dollars, reflecting changes in both the type of subsidies offered and fuels that received support.
EIA's updated study focuses on direct federal financial interventions by the federal government that provide a financial benefit with an identifiable federal budget impact and are specifically targeted at energy markets.
Within this scope are:
- Direct expenditures (cash payments directly to market participants)
- Tax expenditures (reductions in tax payments)
- Investment in research and development (R&D)
- Financial support to federal power marketing administrations (PMAs)
- Credit subsidies to recipients of federal loan guarantees
Some programs that benefit energy markets are not included in the analysis as they have broader applicability beyond the energy industry. For instance, accelerated depreciation tax schedules and domestic manufacturing tax deductions apply to both the energy sector and other industries. Other programs, such as the renewable fuels standard and indemnification laws such as the Price-Anderson Act that limits the liability of nuclear plant operators are not included because they lack a distinguishable federal budget impact.
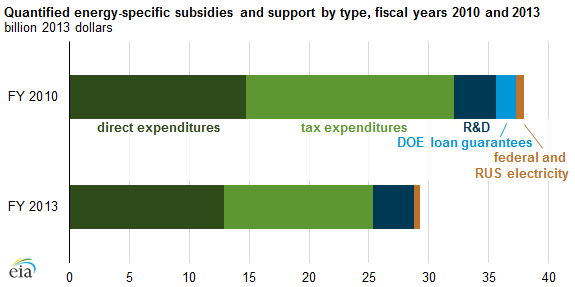
Note: RUS is the U.S. Department of Agriculture's Rural Utilities Service.
Between FY 2010 and 2013, the share of tax expenditure in total financial interventions and subsidies declined from 46% to 42%, while the share of direct expenditures grew from 39% to 44%, reflecting a move from subsidies for renewable liquid fuels such as ethanol to subsidies for renewable electricity, particularly solar power. Since FY 2010, the government has eliminated the Volumetric Ethanol Excise Tax Credit (VEETC) for fuel ethanol, and biofuels' share of total renewable energy subsidies fell from 45% in FY 2010 to 12% in FY 2013.
Meanwhile, the government revised tax credits for a growing solar power industry, allowing subsidy applicants to receive grants in lieu of tax credits. These grants, known as Energy Investment Grants or Section 1603 grants for the tax provision in the Recovery Act that established them, were one of the few energy subsidy programs created by the Recovery Act that still had a substantial budgetary impact by FY 2013.
The Section 1603 grants increased nearly $4 billion between FY 2010 and FY 2013, while electricity-related tax expenditures for renewables doubled from $1.9 billion to $3.8 billion. Electricity-related subsidies, primarily directed towards fuels and technologies used for electricity production, increased in both absolute and percentage terms between FY 2010 and FY 2013, reflecting increases in both direct expenditures and estimated tax subsidies. Wind subsidies increased by less than 10%, going from $5.5 billion in 2010 to $5.9 billion in 2013. However, solar subsidies increased the most, both in absolute and percentage terms, going from $1.1 billion to $5.3 billion in 2013, with declining solar costs and state-level policies also supporting additional growth.
With lower adoption of tax credits for home efficiency improvements and the declining need for the Low Income Home Energy Assistance Program with an improving economy, support for conservation and end-use programs was at $7.9 billion in FY 2013, down from $15.6 billion in FY 2010. Federal subsidy support for fossil fuels declined from almost $4 billion in FY 2010 to $3.4 billion in FY 2013. Within those fossil fuel subsidies, support for coal declined by less than 3%, but support for oil and natural gas declined by almost 20%.
Principal contributors: EIA Staff
Tags: biofuels, coal, electricity, liquid fuels, natural gas, nuclear, oil/petroleum, solar, wind