As cash flow flattens, major energy companies increase debt, sell assets
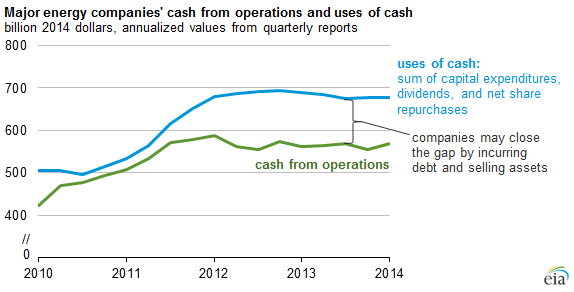
Note: Annualized means each point on the graph is the sum of the previous four quarters. Thus, the first-quarter 2014 results on an annualized basis mean the data represent the sum of the four quarters ending March 31, 2014. The data above are the aggregate results of 127 global oil and natural gas companies.
Cash from operations for major energy companies has flattened in line with flat crude oil prices, which have had the lowest price volatility in years. Based on data compiled from quarterly reports, for the year ending March 31, 2014, cash from operations for 127 major oil and natural gas companies totaled $568 billion, and major uses of cash totaled $677 billion, a difference of almost $110 billion. This shortfall was filled through a $106 billion net increase in debt and $73 billion from sales of assets, which increased the overall cash balance. The gap between cash from operations and major uses of cash has widened in recent years from a low of $18 billion in 2010 to $100 billion to $120 billion during the past three years.
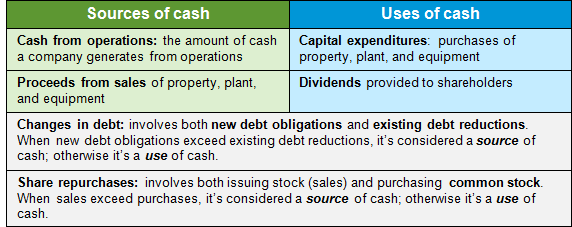
The cash flow statement is one of the most useful items in a company's financial report for analyzing its major sources and uses of cash over a given period. While there are many line items to compare, the largest drivers of cash inflow and cash outflow are summarized in the table below.
Average cash from operations from 2012 through first quarter 2014 increased $59 billion, or 12%, compared to its 2010-11 average. At the same time, major uses of cash increased by $136 billion, from an average of $548 billion in 2010-11 to $684 billion in the 2012-14 period. While capital expenditures, typically the largest use of cash, accounted for most of the increase, cash spent on share repurchases increased $39 billion on average. In fact, net share repurchases was a source of cash for the 2010-11 average, changing to a net use of cash in mid-2011.
To meet spending with relatively flat growth in cash from operations, companies increased their borrowing. When comparing the major sources of cash for the first quarter only, the net increase in debt has made up at least 20% of cash since 2012.
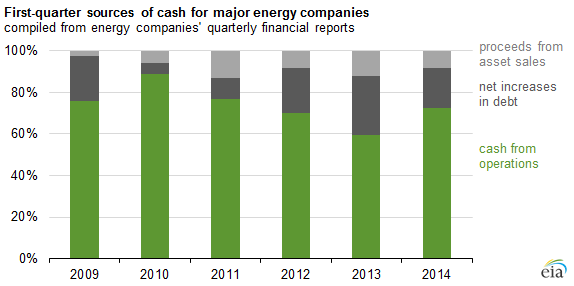
An increase in debt is not necessarily a negative indicator. Low borrowing rates have allowed companies to use outside sources of capital (debt) to meet their spending needs. Production in North America, where many of the reporting companies have major operations, has increased dramatically in recent years. Using debt to fuel growth is a typical strategy, particularly among smaller producers. The increased debt load is anticipated to be met with increased production, generating more revenue to service future debt payments.
Principal contributor: Jeff Barron
Tags: financial markets