EIA projects record natural gas storage injection in 2014 to boost stocks from 11-year low
Republished March 13, 2014, 12:45 p.m., text and graph were updated.
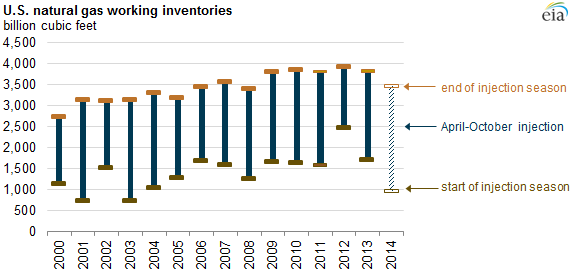
A winter of prolonged, widespread, bitter cold weather throughout much of the United States led to a record-breaking natural gas withdrawal season in 2014, bringing inventories of natural gas to a 11-year low. EIA's Short-Term Energy Outlook (STEO) forecasts a robust injection season (April-October) with nearly 2,500 billion cubic feet (Bcf) added to storage as operators seek to rebuild inventory levels.
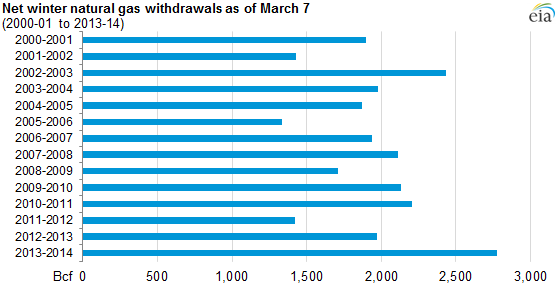
The projected inventory level at the end of the current withdrawal season at the end of March results from a record winter withdrawal of 2,851 Bcf. Demand driven by cold weather has played a major role in driving this winter's high withdrawals. From November 1, 2013 through March 10, 2014, U.S. consumption of natural gas averaged 91.2 billion cubic feet per day (Bcf/d), an increase of 10% over the same days last winter and 13% over the average for these days during the past five winters. Residential/commercial consumption increased by 17% over the same days in the 2012-13 winter season, while population-weighted heating degree days (indicating cold weather) increased by 16%, according to data from Bentek Energy LLC.
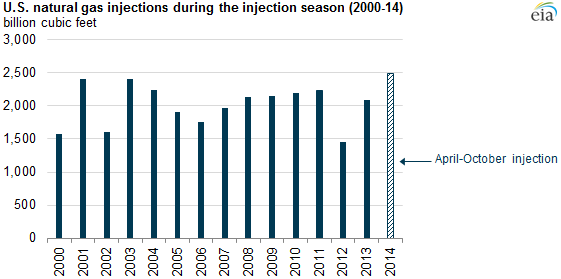
STEO projects relatively high natural gas production growth and moderate demand growth starting in April that will allow for a record storage build through October. The forecasted April-to-October storage build of nearly 2,500 Bcf would surpass the previous record injection season net inventory build (April-October, 2001) by more than 90 Bcf, to end the injection season at 3,459 Bcf. While the projected storage build for the upcoming injection season would be a record, total Lower 48 end-October inventories in 2014 would still be at their lowest level since 2008. High injections would not fully erase the deficit in storage volumes caused by this winter's heavy withdrawals.
The STEO expects spot prices will be in the low $4 per million British thermal unit (MMBtu) range over the summer, a level high enough to limit the growth of natural gas use in the electric power sector. As a result, and assuming close-to-normal weather this summer, EIA projects that electric power consumption of gas from April to October will be 23.9 Bcf/d, essentially flat compared to year-ago levels. Expected dry natural gas production during this period reaches 68.1 Bcf/d, a 2% increase over last year.
The tabs below provide additional detail on storage dynamics during this winter's natural gas withdrawal season.
Source: U.S. Energy Information Administration, Weekly Natural Gas Storage Report
November-to-March natural gas net withdrawals this winter are running 14% above the previous record of 2,436 Bcf, set during the 2002-03 winter season.
Source: U.S. Energy Information Administration, Weekly Natural Gas Storage Report
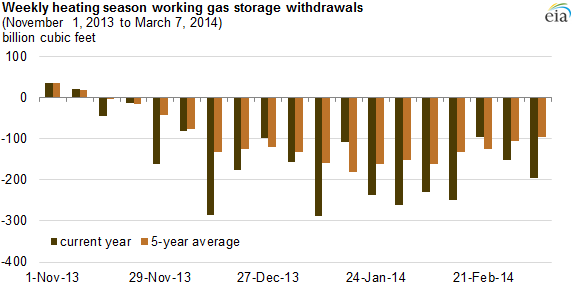
This winter marked the first time that weekly net storage withdrawals of more than 200 Bcf occurred over four consecutive weeks, from the week ending January 24 to the week ending February 14, 2014, according to data from EIA's Weekly Natural Gas Storage Report (WNGSR).
Source: U.S. Energy Information Administration, Weekly Natural Gas Storage Report
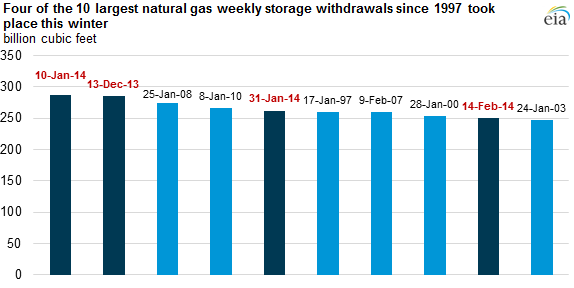
Four of the 10 largest recorded weekly natural gas inventory net withdrawals occurred during the 2013-14 winter season, according to WNGSR data.
Principal contributors: Katie Teller, Mike Ford