Renewable generation provides a growing share of California’s electricity
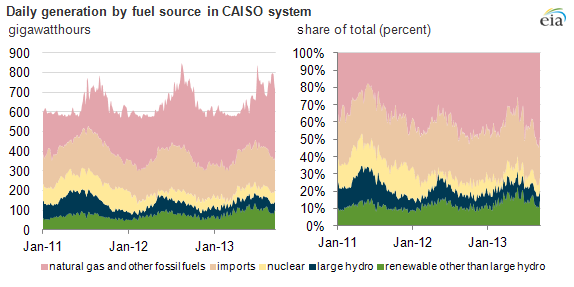
Note: The generation data above are the seven-day rolling averages. CAISO classifies small hydroelectric units as renewable, while larger units are broken out separately as hydroelectric generation. These aggregations are represented in the chart above.
Most of the electricity used in California continues to come from in-state generators fueled by natural gas and imports from a variety of generation sources in other portions of the western interconnection. While the contribution of renewable generation has been increasing, the role of nuclear generation has dropped considerably since the shutdown of the two-unit San Onofre Nuclear Generating Station (SONGS) in January 2012.
In addition to the need for replacement power, the loss of SONGS, which is located in a region between Los Angeles and San Diego that uses large amounts of electricity, posed significant challenges for the operation of the regional transmission grid. Recent transmission upgrades along with capacity additions fueled by both renewable sources and natural gas have been implemented to help strengthen the grid in Southern California.
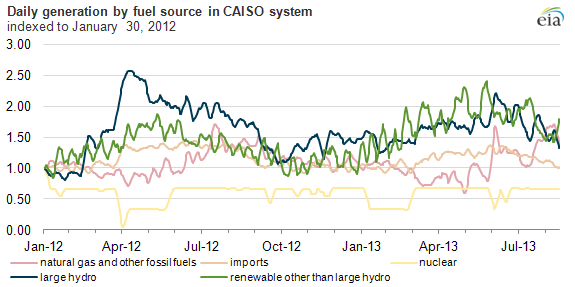
The graph below shows the daily generation by fuel on the CAISO system since the last full day of operation of SONGS (January 30, 2012), indexed to that day to illustrate the changing composition of fuel use since then. Spring typically is the peak output season for hydroelectric units in the West, which was particularly true in April and May of 2012, when hydroelectric output increased significantly. Similarly, the spring typically experiences the highest level of generation from renewable sources in California because wind speeds increase during this season.
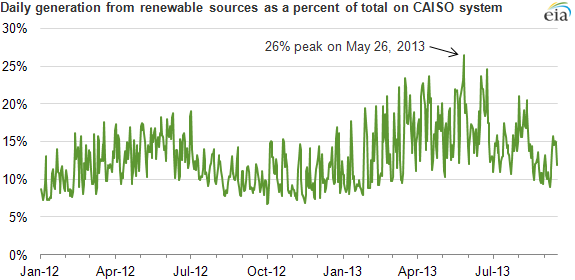
The combination of an aggressive state renewable portfolio standard, continued federal tax credits, grants, and other support, along with the implementation of a state greenhouse gas emissions cap-and-trade program, has encouraged significant additions of renewable capacity. These capacity additions, along with a particularly windy spring, contributed to a record 26% of the generation in the CAISO system coming from renewable energy sources on May 26, 2013.
Principal contributor: M. Tyson Brown
Tags: California, electricity, generation, nuclear, renewables