World petroleum use sets record high in 2012 despite declines in North America and Europe
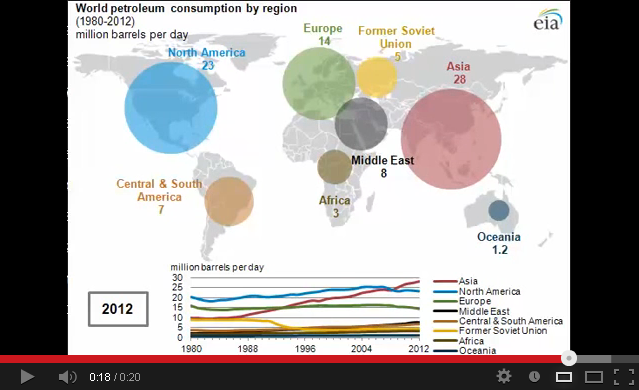
The world's consumption of gasoline, diesel fuel, jet fuel, heating oil, and other petroleum products reached a record high of 88.9 million barrels per day (bbl/d) in 2012, as declining consumption in North America and Europe was more than outpaced by growth in Asia and other regions (see animated map). A previous article examined regional trends in petroleum consumption between 1980 and 2010; today's article extends that analysis through 2012.
Note: Oceania is grouped with Asia; it accounts for 1% of world consumption.
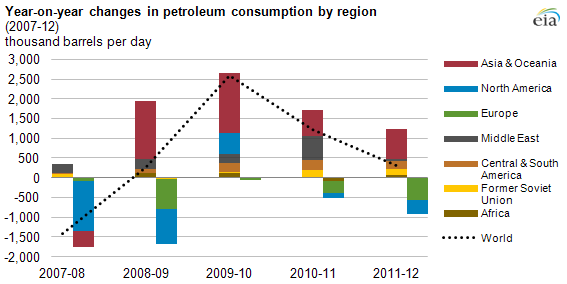
Some recent annual trends in Asia, North America, and Europe, the world's three top petroleum-consuming regions, are discussed below:
Asia. In 2009, Asia surpassed North America as the world's largest petroleum-consuming region as consumption rebounded from its 2008 decline. Between 2008 and 2012, Asia's consumption increased by 4.4 million bbl/d. The rapidly industrializing economies of China and India fueled much of Asia's demand increase, growing 2.8 million bbl/d and 800,000 bbl/d, respectively. If China's use of petroleum continues to grow as projected, it is expected to replace the United States as the world's largest net oil importer this fall.
North America. Petroleum use in North America, which is dominated by consumption in the United States, has declined since 2005. Declines in petroleum consumption in the United States in 2008 and 2009 occurred during the economic downturn. Increased consumption in 2010 reflected improving economic conditions. In 2011 and 2012, higher oil prices and increased fuel efficiency of light-duty vehicles contributed to reduced U.S. consumption. Motor gasoline consumption, which makes up almost half of total U.S. liquids fuel consumption, fell by 290,000 bbl/d between 2010 and 2012 as the Corporate Average Fuel Economy standards led to improvements in vehicle fuel economy that outpaced highway travel growth.
Europe. Petroleum use in Europe has declined in every year since 2006. Part of this decline was related to a reduction in overall energy intensity and government policies that encourage energy efficiency. Europe's weak economic performance has also affected its petroleum use, with declines of 780,000 bbl/d in 2009 and 570,000 bbl/d in 2012 occurring at a time of slow growth and/or recessions in many European countries.
Further detail on the outlook for petroleum consumption can be found in EIA's Short-Term Energy Outlook, International Energy Outlook 2013, and Annual Energy Outlook 2013.