EIA projects natural gas inventories to reach 3,800 billion cubic feet by November
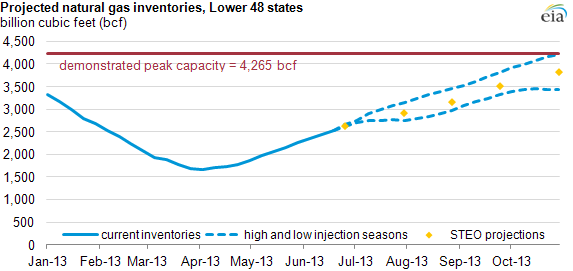
Note: The high injection scenario shows actual injections from 2003, a year of high injections, and the low injection scenario shows actual injections in 2006, a year of low injections, for the remainder of the injection season. Demonstrated peak capacity of 4,265 bcf is the sum of the highest storage inventory level of working gas in each facility between 2008 and 2012. The timing for peaks at facilities need not coincide.
Working natural gas in storage is expected to total about 3,800 billion cubic feet (bcf) on October 31, 2013—the nominal end of the summer injection season. Injections of natural gas into storage often continue into November, depending on weather and storage levels at the time.
The graph above illustrates EIA's projection of how much natural gas will likely be injected by November 2013, along with EIA's estimate of the demonstrated peak capacity, and representative profiles of seasons that had relatively higher (2003) and lower (2006) injections.
Summer 2013 natural gas injections should outpace last year's levels because aggregate storage at the April 1 start of the injection season was 31% lower than in 2012, when storage was unusually high after an extremely mild winter. To meet their target storage inventory levels for the start of the 2013/14 winter, many local distribution companies will need to increase the amount of natural gas they have in underground storage fields this summer compared to last summer. Moreover, so far this injection season, higher natural gas production and lower gas use for power generation have contributed to more injections compared to 2012. Use of natural gas for power generation was about 20% less than last year during the second quarter of 2013 (April, May, and June), and the Short-Term Energy Outlook (STEO) projects third-quarter consumption will average about 12% less than in the same quarter of 2012.
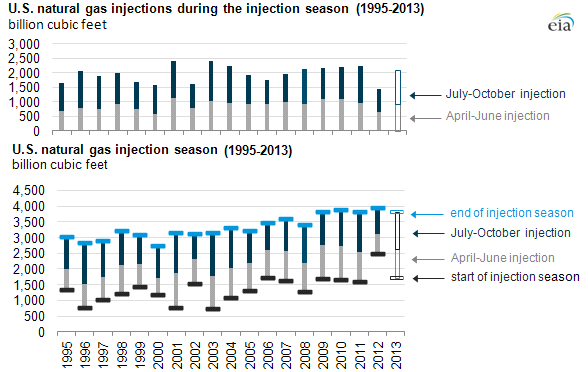
Total injections this summer will be similar to those in 2008-11 but much higher than in 2012 (see chart below). Two key factors affected injections during summer 2012: starting inventories and gas use for power. Injections were historically low last summer because the warmest winter in 60 years left end-of-season inventories at record highs. Moreover, the lowest spring natural gas prices in 10 years boosted natural gas use for electricity generation, as generators substituted natural gas for coal by changing the dispatch order of their generation plants.
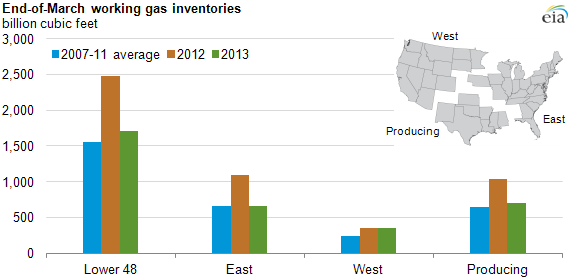
A colder-than-normal March this year contributed to a late winter drawdown of natural gas stocks in both the East and Producing regions, but Lower 48 inventories were still 10% above the 2007-11 average (see chart below). End-of-March stocks by storage region were: East Region (661 Bcf); West Region (344 Bcf); and the Producing Region (705 Bcf). Forecast consumption of natural gas for power generation in 2013 is below year-ago levels, but it is still above the 2007-11 average, which limits the degree to which this year's projected injections will exceed historical levels.
Tags: natural gas, storage