Colorado Quick Facts
- In 2022, Colorado was the fifth-largest crude oil-producing state, with 82% of production coming from Weld County.
- Colorado was the eighth-largest natural gas-producing state in 2022 and has the eighth-largest natural gas reserves.
- Since 2010, Colorado's total renewable electricity net generation has more than quadrupled and accounted for 37% of the state's total generation in 2022. Wind power accounted for almost four-fifths of the state's renewable electricity in 2022.
- Colorado ranks among the top 10 states in total energy production, and its per capita total energy consumption is lower than two-thirds of the states.
- As of April 2023, Colorado had more than 4,000 public electric vehicle (EV) fast-charging ports, the seventh-highest among the states. Colorado is aiming to increase the share of EV sales to at least 70% of new vehicle sales by 2030.
Last Updated: May 18, 2023
Data
Last Update: April 18, 2024 | Next Update: May 16, 2024
| Prices | |||||
|---|---|---|---|---|---|
| Petroleum | Colorado | U.S. Average | Period | find more | |
| Domestic Crude Oil First Purchase | $ 69.53 /barrel | $ 72.26 /barrel | Jan-24 | ||
| Natural Gas | Colorado | U.S. Average | Period | find more | |
| City Gate | $ 5.09 /thousand cu ft | $ 4.76 /thousand cu ft | Jan-24 | find more | |
| Residential | $ 9.44 /thousand cu ft | $ 11.82 /thousand cu ft | Jan-24 | find more | |
| Coal | Colorado | U.S. Average | Period | find more | |
| Average Sales Price | $ 65.00 /short ton | $ 54.46 /short ton | 2022 | ||
| Delivered to Electric Power Sector | $ 2.12 /million Btu | $ 2.48 /million Btu | Jan-24 | ||
| Electricity | Colorado | U.S. Average | Period | find more | |
| Residential | 14.26 cents/kWh | 15.45 cents/kWh | Jan-24 | find more | |
| Commercial | 10.84 cents/kWh | 12.68 cents/kWh | Jan-24 | find more | |
| Industrial | 8.28 cents/kWh | 8.10 cents/kWh | Jan-24 | find more | |
| Reserves | |||||
|---|---|---|---|---|---|
| Reserves | Colorado | Share of U.S. | Period | find more | |
| Crude Oil (as of Dec. 31) | 1,469 million barrels | 3.6% | 2021 | find more | |
| Expected Future Production of Dry Natural Gas (as of Dec. 31) | 19,824 billion cu ft | 3.4% | 2021 | find more | |
| Expected Future Production of Natural Gas Plant Liquids | 1,667 million barrels | 6.4% | 2021 | find more | |
| Recoverable Coal at Producing Mines | 287 million short tons | 2.5% | 2022 | find more | |
| Rotary Rigs & Wells | Colorado | Share of U.S. | Period | find more | |
| Natural Gas Producing Wells | 31,939 wells | 6.6% | 2020 | find more | |
| Capacity | Colorado | Share of U.S. | Period | ||
| Crude Oil Refinery Capacity (as of Jan. 1) | 103,000 barrels/calendar day | 0.6% | 2023 | ||
| Electric Power Industry Net Summer Capacity | 19,514 MW | 1.6% | Jan-24 | ||
| Supply & Distribution | |||||
|---|---|---|---|---|---|
| Production | Colorado | Share of U.S. | Period | find more | |
| Total Energy | 3,630 trillion Btu | 3.7% | 2021 | find more | |
| Crude Oil | 443 thousand barrels per day | 3.5% | Jan-24 | find more | |
| Natural Gas - Marketed | 1,833,019 million cu ft | 4.6% | 2022 | find more | |
| Coal | 12,782 thousand short tons | 2.1% | 2022 | find more | |
| Total Utility-Scale Net Electricity Generation | Colorado | Share of U.S. | Period | find more | |
| Total Net Electricity Generation | 5,258 thousand MWh | 1.4% | Jan-24 | ||
| Utility-Scale Net Electricity Generation (share of total) | Colorado | U.S. Average | Period | ||
| Petroleum-Fired | 0.4 % | 0.4 % | Jan-24 | find more | |
| Natural Gas-Fired | 32.6 % | 42.2 % | Jan-24 | find more | |
| Coal-Fired | 35.9 % | 19.9 % | Jan-24 | find more | |
| Nuclear | 0.0 % | 18.2 % | Jan-24 | find more | |
| Renewables | 30.9 % | 18.8 % | Jan-24 | ||
| Stocks | Colorado | Share of U.S. | Period | find more | |
| Motor Gasoline (Excludes Pipelines) | 4 thousand barrels | * | Jan-24 | ||
| Distillate Fuel Oil (Excludes Pipelines) | 663 thousand barrels | 0.7% | Jan-24 | find more | |
| Natural Gas in Underground Storage | 108,669 million cu ft | 1.5% | Jan-24 | find more | |
| Petroleum Stocks at Electric Power Producers | 90 thousand barrels | 0.4% | Jan-24 | find more | |
| Coal Stocks at Electric Power Producers | 3,193 thousand tons | 2.6% | Jan-24 | find more | |
| Fueling Stations | Colorado | Share of U.S. | Period | ||
| Motor Gasoline | 1,533 stations | 1.4% | 2021 | ||
| Propane | 46 stations | 1.9% | Mar-24 | ||
| Electric Vehicle Charging Locations | 2,090 stations | 3.4% | Mar-24 | ||
| E85 | 91 stations | 2.1% | Mar-24 | ||
| Biodiesel, Compressed Natural Gas, and Other Alternative Fuels | 18 stations | 0.6% | Mar-24 | ||
| Consumption & Expenditures | |||||
|---|---|---|---|---|---|
| Summary | Colorado | U.S. Rank | Period | ||
| Total Consumption | 1,510 trillion Btu | 26 | 2021 | find more | |
| Total Consumption per Capita | 260 million Btu | 33 | 2021 | find more | |
| Total Expenditures | $ 20,474 million | 25 | 2021 | find more | |
| Total Expenditures per Capita | $ 3,523 | 41 | 2021 | find more | |
| by End-Use Sector | Colorado | Share of U.S. | Period | ||
| Consumption | |||||
| » Residential | 378 trillion Btu | 1.8% | 2021 | find more | |
| » Commercial | 289 trillion Btu | 1.7% | 2021 | find more | |
| » Industrial | 417 trillion Btu | 1.3% | 2021 | find more | |
| » Transportation | 426 trillion Btu | 1.6% | 2021 | find more | |
| Expenditures | |||||
| » Residential | $ 4,263 million | 1.5% | 2021 | find more | |
| » Commercial | $ 3,069 million | 1.5% | 2021 | find more | |
| » Industrial | $ 2,993 million | 1.3% | 2021 | find more | |
| » Transportation | $ 10,149 million | 1.7% | 2021 | find more | |
| by Source | Colorado | Share of U.S. | Period | ||
| Consumption | |||||
| » Petroleum | 96 million barrels | 1.3% | 2021 | find more | |
| » Natural Gas | 503 billion cu ft | 1.6% | 2022 | find more | |
| » Coal | 12,428 thousand short tons | 2.4% | 2022 | find more | |
| Expenditures | |||||
| » Petroleum | $ 11,983 million | 1.6% | 2021 | find more | |
| » Natural Gas | $ 4,358 million | 1.6% | 2022 | find more | |
| » Coal | $ 449 million | 1.7% | 2022 | find more | |
| Consumption for Electricity Generation | Colorado | Share of U.S. | Period | find more | |
| Petroleum | 40 thousand barrels | 1.4% | Jan-24 | find more | |
| Natural Gas | 13,681 million cu ft | 1.2% | Jan-24 | find more | |
| Coal | 1,086 thousand tons | 2.6% | Jan-24 | find more | |
| Energy Source Used for Home Heating (share of households) | Colorado | U.S. Average | Period | ||
| Natural Gas | 65.5 % | 46.2 % | 2022 | ||
| Fuel Oil | 0.1 % | 3.9 % | 2022 | ||
| Electricity | 26.3 % | 41.3 % | 2022 | ||
| Propane | 4.9 % | 5.0 % | 2022 | ||
| Other/None | 3.2 % | 3.5 % | 2022 | ||
| Environment | |||||
|---|---|---|---|---|---|
| Renewable Energy Capacity | Colorado | Share of U.S. | Period | find more | |
| Total Renewable Energy Electricity Net Summer Capacity | 8,202 MW | 2.4% | Jan-24 | ||
| Ethanol Plant Nameplate Capacity | 160 million gal/year | 0.9% | 2023 | ||
| Renewable Energy Production | Colorado | Share of U.S. | Period | find more | |
| Utility-Scale Hydroelectric Net Electricity Generation | 82 thousand MWh | 0.4% | Jan-24 | ||
| Utility-Scale Solar, Wind, and Geothermal Net Electricity Generation | 1,532 thousand MWh | 3.3% | Jan-24 | ||
| Utility-Scale Biomass Net Electricity Generation | 11 thousand MWh | 0.3% | Jan-24 | ||
| Small-Scale Solar Photovoltaic Generation | 127 thousand MWh | 2.7% | Jan-24 | ||
| Fuel Ethanol Production | 3,382 thousand barrels | 0.9% | 2021 | ||
| Renewable Energy Consumption | Colorado | U.S. Rank | Period | find more | |
| Renewable Energy Consumption as a Share of State Total | 14.3 % | 20 | 2021 | ||
| Fuel Ethanol Consumption | 5,443 thousand barrels | 24 | 2021 | ||
| Total Emissions | Colorado | Share of U.S. | Period | find more | |
| Carbon Dioxide | 85.4 million metric tons | 1.7% | 2021 | ||
| Electric Power Industry Emissions | Colorado | Share of U.S. | Period | find more | |
| Carbon Dioxide | 29,739 thousand metric tons | 1.8% | 2022 | ||
| Sulfur Dioxide | 9 thousand metric tons | 0.8% | 2022 | ||
| Nitrogen Oxide | 18 thousand metric tons | 1.5% | 2022 | ||
Analysis
Last Updated: May 18, 2023
Overview
Colorado ranks among the top 10 states in total energy production.
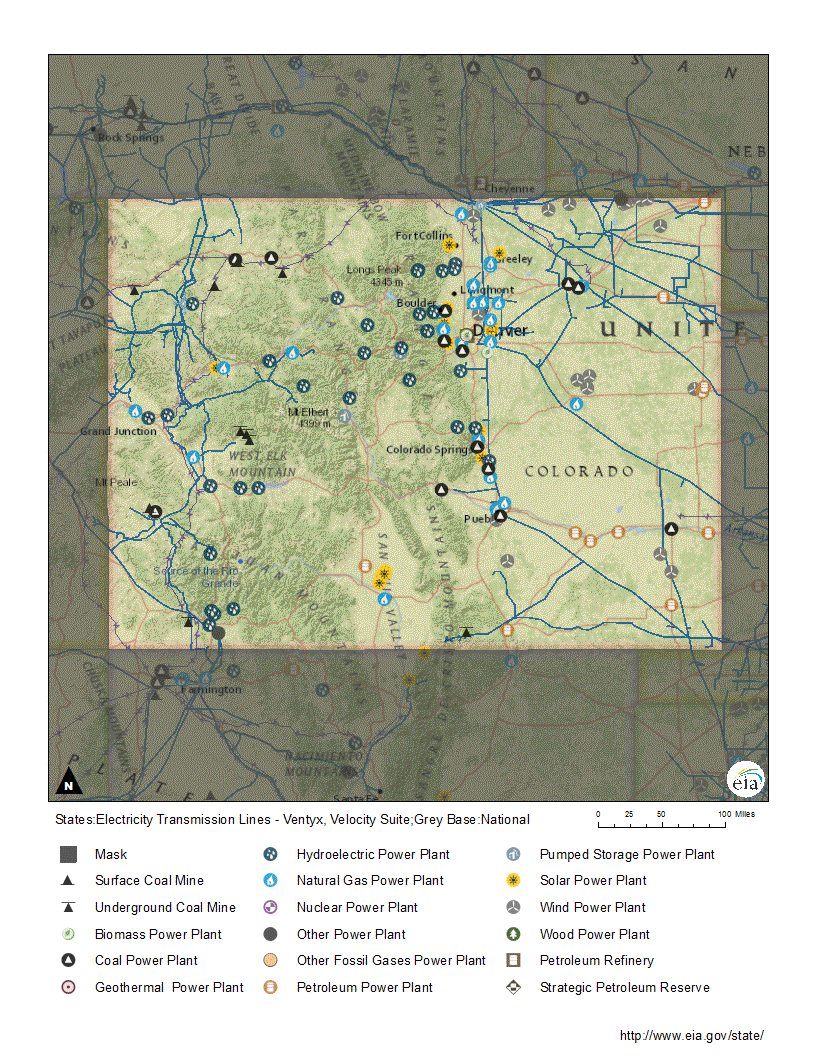
Colorado, a Rocky Mountain state, has abundant fossil fuel reserves and renewable energy resources.1 Its diverse geography and geology include the headwaters of major rivers; significant wind and solar energy resources; and substantial deposits of crude oil, natural gas, and coal.2,3,4,5 Colorado ranks among the top 10 states in total energy production.6 Home to the tallest peaks of the Rocky Mountains, Colorado has the highest average elevation of any state, at 6,800 feet.7 Wide plains, already more than half a mile above sea level at the Kansas border, meet the mountains that run through Colorado's center.8,9 Nearly 9 in 10 Colorado residents live in metropolitan areas at the base of the Range, along the eastern edge of the Rocky Mountains, leaving much of the state's mountainous areas and plains sparsely populated.10
Weather fronts can move in from the west across the mountains or from the east across the plains. Temperatures vary widely, depending on elevation and season, and have reached records of 115°F on the plains and 61°F below zero in the mountains.11 Colorado is a winter sports destination, and about 1 in 20 houses is occupied only seasonally.12,13
Colorado has a diverse economy. Despite its energy intensive mining and oil and gas industries, the amount of energy used to produce one dollar of Colorado's gross domestic product (GDP) is less than in about four-fifths of the states.14 Some of the largest contributors to the state's GDP are finance, insurance, and real estate; professional and business services; and government.15 Partly as a result, Colorado's per capita energy consumption is lower than two-thirds of the states.16 In 2020, the industrial sector was Colorado's leading energy consumer, accounting for 29% of the state's total energy use, followed closely by the transportation and residential sectors at 26% each and the commercial sector at 19%.17
Petroleum
Colorado is the fifth-largest crude oil-producing state and accounts for almost 4% of U.S. total crude oil output.18 The state has nearly 4% of the nation's economically recoverable crude oil reserves.19 In 2022, Colorado produced almost five times more crude oil than in 2010, primarily from the increased use of horizontal drilling and hydraulic fracturing technologies.20,21 Monthly crude oil production peaked in November 2019 at slightly more than 17 million barrels and declined to about 11 million barrels by February 2021, due to the economic impacts of the COVID-19 pandemic.22,23 Crude oil production in 2022 increased by 3%, the first year-on-year increase in two years.24
About four-fifths of Colorado’s crude oil production comes from Weld County.
Most of Colorado's crude oil production comes from the Niobrara Shale formation located in the Denver-Julesburg Basin in northeastern Colorado, where crude oil output in one county, Weld, is the source of 8 out of every 10 barrels of crude oil produced in the state.25,26,27 The Wattenberg field, much of which is in Weld County, in the northern part of the state, is among the top 10 U.S. oil and natural gas fields based on proved reserves.28,29,30 The Piceance Basin in the western mountain region is the other primary crude oil-producing area in Colorado.31,32
Northwestern Colorado overlays part of the Green River oil shale, a kerogen-rich formation.33,34 Kerogen is an organic material found in some sedimentary rocks that can be heated to extract crude oil.35 Although pilot oil shale projects were attempted in the area, obtaining crude oil from kerogen is not economically viable.36,37,38
Colorado has two petroleum refineries in the Denver area, with a combined capacity to process 103,000 barrels of crude oil per calendar day into motor gasoline, diesel fuel, asphalt, jet fuel, and other petroleum products.39,40 Upgrades to the refinery have made it possible to make refined products that meet clean fuel standards and process more crude oil from Canada's tar sands.41 The shutdown of the refinery in December 2022 for several months due to damage from extreme cold weather caused higher gasoline prices in the Rocky Mountain region.42 With crude oil production from the Niobrara Shale increasing and exceeding refining capacity, more pipelines are being built or repurposed to move Colorado crude oil to refineries out of state.43 Demand for petroleum products in Colorado is almost three times more than the state's refining capacity.44,45 Several petroleum product pipelines, primarily from Wyoming, Texas, and Kansas, help supply the Colorado market, and refined products are also brought in by rail and truck.46,47,48,49,50
The transportation sector accounts for more than four-fifths of all petroleum consumed in Colorado, followed by the industrial sector with about one-eighth. The residential and commercial sectors accounted for the rest.51 The Denver-Boulder and Fort Collins metropolitan areas use motor gasoline oxygenated with ethanol to limit smog formation.52,53 The rest of the state is allowed to use conventional motor gasoline.54 Colorado has four fuel ethanol plants with a combined production capacity of 143 million gallons per year. Those facilities mainly use corn as their feedstock.55,56 The state's smallest ethanol plant, located in Golden, uses a brewery's waste beer as its feedstock.57
In April 2019, Colorado's governor signed legislation that changed the way the state regulates its crude oil and natural gas industry.58 The law gives counties and municipalities increased regulatory authority over crude oil and natural gas development in their jurisdictions. Local governments have the authority to regulate the location of new crude oil and natural gas production facilities as well as the effects of production, such as land use and surface impacts, including noise.59 The law also gives local governments the authority to inspect crude oil and natural gas facilities; impose fines for leaks, spills, and emissions; and impose fees to fully cover regulatory costs.60
Natural gas
Colorado has the eighth- largest natural gas reserves in the United States.
Colorado has the eighth-largest natural gas reserves of any state, accounting for almost 4% of the U.S. total.61 It is also the eighth-largest natural gas-producing state in the nation.62 Colorado's marketed natural gas output more than doubled from 2000 to 2022.63 Colorado is home to all or part of 11 of the nation's 100 largest natural gas fields.64
Colorado's largest natural gas-producing regions are in the Denver-Julesburg Basin in the northeast and in the Piceance Basin in the west.65 As natural gas prices fluctuate, some drilling activity moved from the Piceance, which produces mainly dry natural gas, to the Denver-Julesburg Basin, which produces higher-value crude oil and natural gas liquids.66,67 The San Juan Basin that stretches across the Colorado-New Mexico border is also a major natural gas-producing area, though output there has declined in recent years.68
Colorado is the top producer of coalbed methane gas, which is a type of natural gas extracted from coal seams.69 Production of coalbed methane gas grew rapidly in the 1990s and usually accounted for about one-third of Colorado's total marketed natural gas production during that period. Production of coalbed methane declined about 50% from 2010 to 2021, however, Colorado remains the top coalbed methane-producing state, accounting for almost two-fifths of U.S. production in 2021. 70,71 The San Juan and Raton Basins, located in the southern part of the state, produce nearly all of the state's coalbed methane.72
The residential sector is Colorado's largest consumer of natural gas, accounting for about three-tenths of the state's natural gas demand, followed by the electric power sector with one-fourth.73 About 7 out of 10 Colorado households use natural gas as their primary home heating source.74 Consumption of natural gas for electricity generation has declined since 2020, but increased by 11% in 2022, as natural gas prices declined.75,76,77 The state uses only about one-fourth of the natural gas it produces.78,79
Several major interstate pipelines cross Colorado and ship natural gas to six U.S. states.80,81 The state has two natural gas trading hubs at interstate pipeline interconnections.82 The larger Cheyenne hub, near the Colorado-Wyoming border, is located in the Denver-Julesburg Basin, and the White River hub is located in the Piceance Basin.83,84 In June 2020, the Cheyenne Connector natural gas pipeline entered service, adding 1.6 billion cubic feet per day of throughput capacity and increasing natural gas deliveries from eastern Colorado into the Cheyenne hub. Additionally, the Cheyenne Hub Enhancement Project increased interconnectivity and deliverability between the Rockies Express Pipeline and interstate transmission systems.85 Colorado has 10 underground natural gas storage fields and about 141 billion cubic feet of combined storage capacity, equal to 1.5% of the U.S. total.86 The state's storage capacity increased by one-third from 2010 to 2021, primarily from increased underground storage in depleted gas fields.87,88
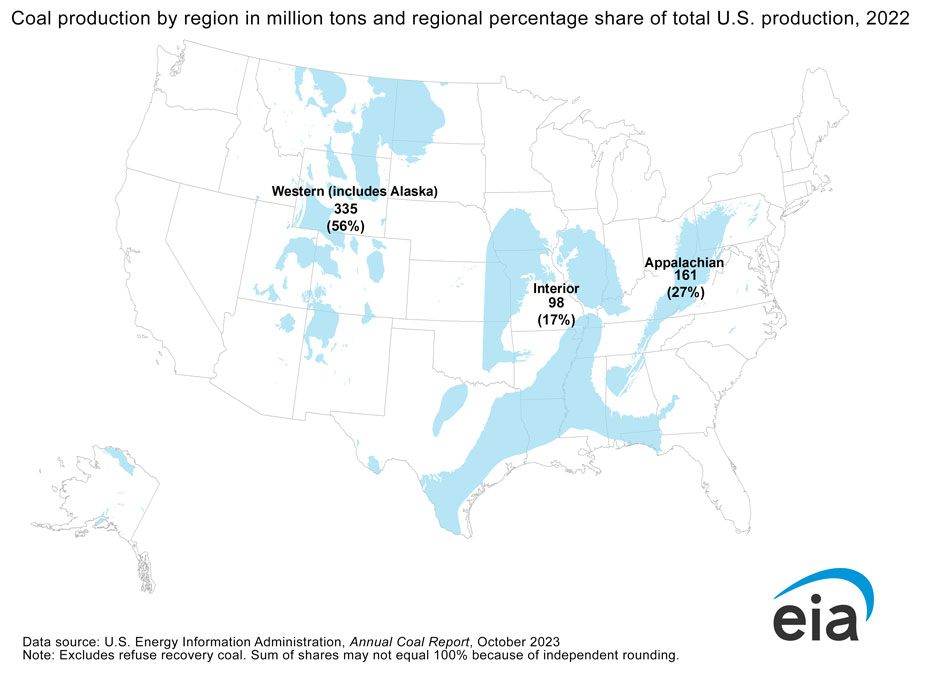
Coal
Colorado ranks eighth among the states in estimated recoverable coal reserves.89,90 The state produces coal from both underground and surface mines. Currently, mining is focused in the Green River, Piceance, and San Juan Basins.91,92 Colorado's coal is used almost entirely for electricity generation, but the market for the state's coal has decreased and several Colorado mines have closed as the share of U.S. electricity generated by coal-fired power plants continues to decline.93,94,95,96 Although Colorado's coal production has been decreasing since 2004, it increased in 2017, due to an increase in foreign demand for U.S. coal. However, coal exports from Colorado declined from a high of almost 25% of production in 2018 to 4% in 2021. Coal production saw almost an 8% increase in 2022 due to an increase in domestic demand due to higher natural gas prices.97,98,99,100 Slightly more than two-thirds of the coal mined in Colorado is used for power generation within the state. Coal is also transported for electric power generation or used at industrial plants in 16 other states.101
Electricity
Coal-fired power plants accounted for 36% of the state's total electricity net generation in 2022, down from 68% in 2010. However, in 2021, Colorado's electricity net generation from coal-fired plants increased to 41%, as higher natural gas prices made coal-fired generation more economical.102,103 In 2022, this demand declined as natural gas prices became more competitive.104 Colorado's power plant operators plan to continue to replace coal-fired capacity with generating capacity fueled by natural gas and renewable energy sources due to economic and regulatory considerations.105,106,107 By 2029, 2,549 megawatts of coal-fired generating capacity in Colorado is scheduled to retire.108 Renewable energy provided almost two-fifths of the state's electricity net generation in 2022. Since 2010, Colorado's renewable electricity net generation has more than quadrupled. In 2022, wind energy provided 28% of the state's total electricity generation, followed by natural gas with 26%. The rest of Colorado's in-state electricity generation was provided by utility- and small-scale solar, and hydroelectric power.109
Colorado’s electricity generation from renewable energy sources more than quadrupled between 2010 and 2022.
Colorado does not have any nuclear power plants.110 The state does have some uranium deposits, but no uranium has been mined since 2005.111,112 A proposed uranium mill in western Colorado is still being considered.113
Colorado uses less electricity per capita than three-fourths of the states.114 The commercial and residential sectors are the largest consumers of electricity in Colorado, together account for about three-fourths of the state's total power use, followed by the industrial sector at just over one-fourth.115 About one in four Colorado households use electricity as the main home heating source.116 Typically, total electricity consumption exceeds in-state generation, but in 2021 in-state generation increased by 5%, slightly exceeding electricity consumption.117 The state receives electricity from Wyoming, Nebraska, Kansas, New Mexico, and Utah over high voltage interstate transmission lines.118 In February 2022, Colorado utility regulators approved a proposal to add 560 miles of high-voltage transmission lines in the Eastern Plains, which includes the large population cities of Denver and Fort Collins.119,120
In 2018, Colorado launched the Electric Vehicle (EV) Fast-Charging Corridor grant program to develop EV fast-charging infrastructure in the state to promote the adoption of EVs.121,122 Colorado currently has more than 1,750 public access charging stations with over 4,000 charging ports, ranking seventh among states.123,124 Colorado is 1 of 13 states that adopted the Zero Emission Vehicle (ZEV) program.125 The ZEV program requires automakers to sell a specific number of no or low-emissions vehicles and invest in clean technology.126 In March 2023, Colorado released the 2023 Colorado EV Plan, with a goal to increase the share of EV sales to at least 70% of new vehicle sales by 2030.127
Renewable energy
In 2022, renewable sources of energy accounted for 37% of Colorado's total in-state electricity net generation. Wind power accounted for the largest share of Colorado's renewable electricity generation at 75%, followed by combined utility-scale (1-megawatt or larger) photovoltaic and small-scale (less than 1 megawatt) solar at 17%. Conventional hydroelectric power accounted for 8% and biomass less than 1%.128
Colorado has significant wind energy resources on its eastern plains and mountain crests and ranks seventh nationwide in installed wind power generating capacity.129,130 The state's use of wind power was four times greater in 2022 than it was in 2010.131 In 2022, one new wind power project added 145 megawatts of capacity, bringing Colorado's total wind generating capacity to 5,136 megawatts. An additional 380 megawatts of wind power capacity are scheduled to come online by the end of 2024.132,133
In 2022, Colorado ranked seventh nationwide in installed wind power capacity.
Colorado has substantial solar resources, especially in the south near the New Mexico border.134 In 2022, Colorado ranked 11th among the states in utility-scale solar power-generating capacity with 1,294 megawatts installed. An additional 1,722 megawatts of solar power capacity is scheduled to be operating by the end of 2024.135,136 Small-scale, customer-sited solar power generating systems (less than 1 megawatt in capacity) continue to grow and accounted for about two-fifths of the state's total solar generation in 2022.137,138 Colorado offers rebates and tax incentives to encourage homeowners and businesses to install solar panels, including community solar gardens, which are collections of solar panels shared by several residences.139,140,141 The Bureau of Land Management established the Solar Energy Program for six southwestern states. Four areas in Colorado were identified as Solar Energy Zones (SEZ) that are well suited for utility-scale solar development.142,143
Colorado has 69 mostly small hydroelectric generators, ranging in size from 500 kilowatts to 180 megawatts, with a total installed capacity of 1,271 megawatts.144 According to the U.S. Bureau of Reclamation, the state has the potential to develop more than 30 new small hydropower projects using existing infrastructure.145 Colorado negotiated an agreement with the U.S. Federal Energy Regulatory Commission to streamline the licensing process for small hydropower facilities.146 The Colorado Energy Office created the Energy Recovery Hydropower Initiative and a small hydropower grant and loan financing program to assist potential developers.147
Colorado's only utility-scale woody biomass plant came online in 2013 and burns waste gathered from surrounding forests.148,149 The state also provides tax breaks to promote biomass generation from anaerobic digestion, which burns the biogas produced from livestock manure or food waste to generate electricity.150,151,152,153
Colorado has a number of hot springs, and studies indicate that the state has significant geothermal energy potential.154 Two bills were signed into law in 2022 to foster geothermal technologies.155,156 Some federal lands in the state have been leased for geothermal projects.157 The state's geothermal resources are mainly used for heating or cooling homes, businesses, recreational pools, and Colorado's state capitol building in Denver. Currently, there are no utility-scale projects that generate electricity with geothermal energy.158,159,160
In 2004, Colorado became the first state with a voter-approved renewable portfolio standard (RPS). The legislature amended the RPS several times and as of 2020, the RPS requires 30% of electricity sold by investor-owned utilities to be generated from renewable energy sources, with 3% from small-scale distributed generation. Separate requirements apply to municipal and cooperative electricity suppliers, depending on their size.161 Xcel Energy and Black Hills Energy, the state's two largest investor-owned utilities, have met this 30% requirement.162,163 In 2019, Colorado's governor proposed a roadmap for 100% of the state's electricity generation to come from renewable resources by 2040.164,165,166,167 In January 2021, Colorado released its Greenhouse Gas Pollution Reduction Roadmap detailing how the state plans to reduce its greenhouse gas emissions by 26% from 2005 levels by 2025, 50% by 2030, and 90% by 2050.168
Endnotes
1 Colorado Geological Survey, Energy, accessed April 13, 2023.
2 Colorado Encyclopedia, Colorado: An Overview, accessed April 13, 2023.
3 Colorado Geological Survey, Geology, accessed April 13, 2023.
4 U.S. Department of Energy, Energy Efficiency and Renewable Energy, WINDExchange, Wind Energy in Colorado, accessed April 13, 2023.
5 Colorado Geological Survey, Non-renewable Energy, accessed April 13, 2023.
6 U.S. EIA, State Energy Data System (SEDS): 1960-2020, Table P5B. Primary Energy Production Estimates, Renewable and Total Energy, in Trillion Bru, Ranked by State, 2020.
7 Colorado Tourism, Colorado Travel Fact, accessed April 13, 2023.
8 U.S. Geological Survey, Region 7: Upper Colorado Basin, accessed April 13, 2023.
9 Colorado Tourism Office, Colorado Mountains: 6 Famous Peaks, updated September 13, 2022.
10 U.S. Census Bureau, Colorado: 2020 Census, Colorado Among Fastest-Growing States Last Decade, August 25,2021.
11 National Oceanic and Atmospheric Administration, Climate at a Glance, Statewide, accessed April 13, 2023.
12 U.S. Census Bureau, Census Reporter, Colorado, Table B25004, ACS 2021 1-year.
13 U.S. Census Bureau, Census Reporter, Colorado, Table B25002, ACS 2021 1-year.
14 U.S. EIA, State Energy Data Systems, Table C10, Total Energy Consumption Estimates, Real Gross Domestic Product (GDP), Energy Consumption per Real Dollar of GDP, Ranked by State, 2020.
15 U.S. Department of Commerce, Bureau of Economic Analysis, Interactive Data, Regional Data, GDP and Personal Income, Annual Gross Domestic Product (GDP) by State, GDP in current dollars (SAGDP2), NAICS (1997-forward), Colorado, All statistics in table, 2022, updated March 31, 2023.
16 U.S. EIA, Rankings: Total Energy Consumed per Capita, 2020.
17 U.S. EIA, State Energy Data System, Table C11, Energy Consumption Estimates by End Use Sector, Ranked by State, 2020.
18 U.S. EIA, Crude Oil Production, Annual-Thousand Barrels per Day, 2016-22.
19 U.S. EIA, Crude Oil Proved Reserves, Reserves Changes, and Production, Proved Reserves as of 12/31, Annual, 2015-21.
20 U.S. EIA, Colorado Field Production of Crude Oil, Monthly-Thousand Barrels, 1981-2023.
21 U.S. EIA, "Hydraulically fractured horizontal wells account for most of new oil and gas well," Today in Energy (January 30, 2018).
22 U.S. EIA, Crude Oil Production, Monthly-Thousand Barrels per Day, 1920-2023.
23 U.S. EIA, Petroleum & Other Liquids, Cushing, OK WTI Spot Price FOC (Dollars per Barrel), 1980-2022.
24 U.S. EIA, Colorado Field Production of Crude Oil, Annual-Thousand Barrels, 1981-2022.
25 U.S. EIA, Drilling Productivity Report, Niobrara Region, March 2023.
26 Colorado Oil & Gas Conservation Commission, COGCC Reports Portal, Monthly Oil Produced by County, 2022.
27 Colorado Department of Education, Colorado Counties Map, accessed April 17, 2023.
28 U.S. EIA, Top 100 U.S. Oil & Gas Fields (March 2015), p. 5.
29 "Information on the Niobrara-DJ Basin," Natural Gas Intelligence Shale Daily, accessed April 17, 2023.
30 Weld County Colorado, Weld County Oil and Gas, April 3, 2023.
31 Colorado Oil & Gas Conservation Commission, COGCC Reports Portal, Monthly Oil Produced by County, 2022.
32 U.S. Geological Survey, The Uinta-Piceance Province-Introduction to a geologic assessment of undiscovered oil and gas resources, DDS-69-B, Chapter 2, accessed April 17, 2023.
33 U.S. Government Accountability Office, Unconventional Oil and Gas Production: Opportunities and Challenges of Oil Shale Development, GAO-12-740T (May 10, 2012).
34 University of Colorado Boulder, Center of the American West, Reading Room, Energy & Mining, Oil Shale, Welcome to Shale Country, accessed April 17, 2023.
35 U.S. EIA, Glossary, Kerogen, accessed April 17, 2023.
36 U.S. Department of Energy, Oil Shale Research in the United States, 3rd Edition, September 2011.
37 Colson, John, "Shell shuts down oil shale pilot project near Rifle," Post Independent (September 26, 2013).
38 Peixe, Joao, "ExxonMobil Takes Step Forward on Colorado Oil Shale," OilPrice.com (March 28, 2014).
39 Suncor, Commerce City Refinery, accessed April 26, 2023.
40 U.S. EIA, Refinery Capacity Report (January 1, 2022), Table 1, Number and Capacity of Operable Petroleum Refineries by PAD District and State as of January 1, 2021.
41 Suncor Energy Inc., Refining, accessed April 26, 2023.
42 U.S. EIA, "Colorado refinery outage is causing higher gasoline prices in Rocky Mountain region," Today in Energy ;(February 28, 2023).
43 U.S. EIA, "EIA's liquids pipeline database provides detail on U.S. petroleum infrastructure changes," Today in Energy (June 11, 2020).
44 U.S. EIA, State Energy Data System, Table F16, Total Petroleum Consumption Estimates, 2020.
45 U.S. EIA, Refinery Capacity Report (January 1, 2022), Table 1, Number and Capacity of Operable Petroleum Refineries by PADD District and State as of January 1, 2022.
46 U.S. Department of Energy, State and Regional Energy Risk Profiles, State of Colorado, Energy Sector Risk Profile (March 2021), p. 6-7.
47 Magellan Midstream Partners LP, Asset Map, see Refined Products Assets, Product Availability Refined Pipeline, accessed April 17, 2023.
48 Colorado Department of Transportation, Colorado Freight Plan 2019, p. 39, 65.
49 Colorado Oil & Gas Conservation Commission, GIS Online, see Flowlines, accessed April 17, 2023.
50 Colorado Information Marketplace, Crude Oil Rail Terminals in Colorado 2014, accessed April 17, 2023.
51 U.S. EIA, State Energy Data System, Table F16, Total Petroleum Consumption Estimates, 2020.
52 Colorado Secretary of State, Code of Colorado Regulations, Regulation Number 13 Reduction of Carbon Monoxide Emissions from Gasoline Powered Motor Vehicles Through the use of Oxygenated Gasolines, 5 CCR 1001-16, accessed April 17, 2023.
53 American Petroleum Institute, U.S. Gasoline Requirements, as of January 2018.
54 U.S. Environmental Protection Agency, Gasoline Standards, see Gasoline Programs: Gasoline Reid Vapor Pressure (RVP) and Gasoline Winter Oxygenates, accessed April 17, 2023.
55 Renewable Fuels Association, Ethanol Biorefinery Locations, accessed April 17, 2023.
56 U.S. EIA, U.S. Fuel Ethanol Plant Production Capacity (August 8, 2022), Detailed nameplate capacity of fuel ethanol plants by Petroleum Administration for Defense District (PADD District) are available in XLS.
57 Merrick & Company, MillerCoors Ethanol Recovery Facility: Biomass Conversion to Ethanol, accessed April 17, 2023.
58 U.S. EIA, "Colorado changes its regulatory structure for oil and natural gas production," Today in Energy (June 27, 2019).
59 Colorado Oil & Gas Conservation Commission, Senate Bill 19-181 (April 16, 2019).
60 Colorado Oil & Gas Conservation Commission, Colorado General Assembly, Protect Public Welfare Oil and Gas Operations (SB19-181), accessed April 17, 2023.
61 U.S. EIA, Natural Gas Proved Reserves, Wet After Lease Separation, Proved Reserves as of Dec. 31, 2014-21.
62 U.S. EIA, Natural Gas Gross Withdrawals and Production, Marketed Production, Annual-Million Cubic Feet, 2014-22.
63 U.S. EIA, Colorado Natural Gas Marketed Production, 1967-2021.
64 U.S. EIA, Top 100 U.S. Oil & Gas Fields (March 2015), p. 8-10.
65 Colorado Oil & Gas Conservation Commission, GIS Online (Interactive Map), accessed April 17, 2023.
66 Colorado Oil & Gas Conservation Commission, Data, Production by County, Monthly Coalbed & Natural Gas Sold by County, 2011-22.
67 U.S. EIA, "Colorado changes its regulatory structure for oil and natural gas production," Today in Energy (June 27, 2019).
68 Warner, Joe, "San Juan Gas Production Declines to Boost West Gas Volatility?" BTU Analytics (March 5, 2020).
69 U.S. EIA, Natural Gas, Definitions, Sources and Explanatory Notes, Coalbed Methane, accessed April 18, 2023.
70 U.S. EIA, Natural Gas Gross Withdrawals and Production, Colorado Natural Gas Gross Withdrawals from Coalbed Wells, Annual-Million Cubic Feet, 2015-21.
71 U.S. EIA, Natural Gas Gross Withdrawals and Production, Gross Withdrawals from Coalbed Wells, Annual-Million Cubic Feet, 2015-21.
72 Colorado Oil & Gas Conservation Commission, Data, Production by County, Monthly Coalbed Methane Produced by County, 2022.
73 U.S. EIA, Natural Gas Consumption by End Use, Colorado, Annual, 2013-22.
74 U.S. Census Bureau, Census Reporter, Colorado, Table B25040, House Heating Fuel, 2021.
75 U.S. EIA, Colorado Natural Gas Deliveries to Electric Power Consumers, 1997-2022.
76 U.S. EIA, "U.S. natural gas prices likely to remain elevated through the winter," Natural Gas Weekly Update (October 13, 2021).
77 U.S. EIA, Natural Gas, Henry Hub Natural Gas Spot Price, accessed April 14, 2023.
78 U.S. EIA, Natural Gas Gross Withdrawals and Production, Marketed Production, Annual-Million Cubic Feet, 2013-22.
79 U.S. EIA, Natural Gas Consumption by End Use, Colorado, Annual-Million Cubic Feet, 2013-22.
80 U.S. EIA, International & Interstate Movements of Natural Gas by State, Colorado, 2013-21.
81 Colorado Oil & Gas Conservation Commission, GIS Online (Interactive Map), accessed April 18, 2023.
82 A Barrel Full, Operational Natural Gas Market Centers Located in the United States, accessed April 18, 2023.
83 U.S. EIA, "In the first half of 2020, about 5 Bcf/d of natural gas pipeline capacity entered service," Today in Energy (August 24, 2020).
84 White River Hub, Home, accessed April 18, 2023.
85 Dobbs, Peter, "Permian Gains Another Natural Gas Conduit as 1.8 Bcf/d Agua Blanca Ramps Up," Natural Gas Intelligence (January 28, 2021).
86 U.S. EIA, Underground Natural Gas Storage Capacity, Capacity in Million Cubic Feet, Colorado, Annual, 2016-21.
87 U.S. EIA, Natural Gas Underground Storage Capacity, Total Storage Capacity, Annual, 2016-21.
88 Black Hills Energy, Wolf Creek Storage Field update, accessed April 26, 2023.
89 U.S. EIA, Annual Coal Report 2021 (October 18, 2022), Table 15, Recoverable Coal Reserves at Producing Mines, Estimated Recoverable Reserves, and Demonstrated Reserve Base by Mining Method, 2021.
90 U.S. EIA, Coal explained, Where our coal comes from, accessed April 14, 2023.
91 U.S. EIA, Annual Coal Report 2021 (October 18, 2022), Table 2, Coal Production and Number of Mines by State, County, and Mine Type, 2021.
92 Colorado School of Mines, Arthur Lakes Library, Maps and Geospatial Information, Mine maps, accessed April 14, 2023.
93 U.S. EIA, "Coal was the largest source of electricity generation for 15 states in 2021," Today in Energy (December 7, 2022).
94 U.S. EIA, "Coal will account for 85% of U.S. electric generating capacity retirements in 2022," Today in Energy (January 11, 2022).
95 U.S. EIA, Annual Coal Report 2021 (October 18, 2022), Table 26, U.S. Coal Consumption by End Use Sector, Census Division, and State, 2020 and 2021.
96 U.S. EIA, "Increasing renewables likely to reduce coal and natural gas generation over next two years," Today in Energy (January 19, 2023).
97 U.S. EIA, Coal Data Browser, Aggregate coal mine production for all coal (short tons), Colorado, 2001-21.
98 U.S. EIA, Coal Explained, Coal Imports and Exports 1950-2021, updated June 8, 2022.
99 U.S. EIA, Quarterly Coal Report, Production, Table 2. Coal Production by State, updated April 3, 2023.
100 U.S. EIA, Natural Gas, Henry Hub Natural Gas Spot Price, accessed April 14, 2023.
101 U.S. EIA, Annual Coal Distribution Report (October 18, 2022), Domestic distribution of U.S. coal by origin State, consumer, destination, and method of transportation, Colorado, Table OS-4. Domestic Coal Distribution, by Origin State, 2021.
102 U.S. EIA, Electricity Data Browser, Net generation for all sectors (thousand megawatthours), Colorado, Annual, 2001-22.
103 U.S. EIA, "Annual U.S. coal-fired electricity generation will increase for the first time since 2014," Today in Energy (December 21, 2021).
104 U.S. EIA, Natural Gas, Henry Hub Natural Gas Spot Price, 1997-2023.
105 U.S. EIA, "Coal and natural gas plants will account for 98% of U.S. capacity retirements in 2023," Today in Energy (February 7, 2023).
106 Sweeney, Darren, "Xcel Energy agrees to retire largest unit at Colo. coal plant by 2031," S&P Global (April 27, 2022).
107 U.S. EIA, "Increasing renewables likely to reduce coal and natural gas generation over next two years," Today in Energy (January 19, 2023).
108 U.S. EIA, Electricity, Preliminary Monthly Electric Generator Inventory (based on Form EIA-860M as a supplement to Form EIA-860), updated March 24, 2023.
109 U.S. EIA, Electricity Data Browser, Net generation for all sectors (thousand megawatthours), Colorado, Annual, 2001-22.
110 U.S. Nuclear Regulatory Commission, Map of Power Reactor Sites, updated July 17, 2020.
111 Colorado Geological Survey, Uranium, accessed April 14, 2023.
112 U.S. EIA, Domestic Uranium Production Report-Annual (May 18, 2022), Tables 4, 5, 10.
113 U.S. Department of Energy, "Signed Leases Open Door to Future Uranium Mining," (September 15, 2020).
114 U.S. EIA, State Energy Data Systems (SEDS): 1960-2020, Colorado, Table C17. Electricity Retail Sales, Total and Residential, Total and per Capita, Ranked by State, 2020.
115 U.S. EIA, Electricity Data Browser, Retail sales of electricity (million kilowatthours), Colorado, Annual, 2001-22.
116 U.S. Census Bureau, Census Reporter, Colorado, Table B25040, House Heating Fuel, 2021.
117 U.S. EIA, State Electricity Profiles, Colorado Electricity Profile 2021 (November 10, 2022), Table 1. 2021 Summary statistics (Colorado).
118 U.S. Department of Energy, State and Regional Energy Risk Profiles, State of Colorado, Energy Sector Risk Profile (March 2021), p. 2.
119 Xcel Energy, 10-Year Transmission Plan for the State of Colorado - to comply with Rule 3627 of the Colorado Public Utilities Commission Rules Regulating Electric Utilities, February 3, 2020.
120 Xcel Energy, Colorado's Power Pathway, accessed April 14, 2023.
121 Colorado Energy Office, EV Fast-Charging Corridors, accessed April 14, 2023.
122 Colorado Energy Office, Colorado Electric Vehicle Plan (January 2018).
123 U.S. Department of Energy, Alternative Fuels Data Center, Electric Vehicle Supply Equipment (EVSE) Ports by State, Public EVSE Ports, accessed April 14, 2023.
124 U.S. Department of Energy, Alternative Fuels Data Center, Alternative Fueling Station Locator, Colorado, accessed April 14, 2023.
125 State of Vermont, Agency of Natural Resources, Department of Environmental Conservation, Zero Emission Vehicles, accessed April 14, 2023.
126 California Air Resources Board, Zero-Emission Vehicle Program, accessed April 14, 2023.
127 Colorado Energy Office, 2023 Colorado EV Plan, March 2023, p.4.
128 U.S. EIA, Electricity Data Browser, Net generation for all sectors (thousand megawatthours), Colorado, Annual, 2001-22.
129 U.S. Department of Energy, Energy Efficiency & Renewable Energy, WINDExchange, Wind Energy in Colorado, accessed April 19, 2023.
130 U.S. EIA, Electric Power Monthly, Table 6.2.B. Net Summer Capacity Using Primarily Renewable Energy Sources and by State, January 2023 and 2022 (Megawatts).
131 U.S. EIA, Electricity Data Browser, Net generation for all sectors (thousand megawatthours), Colorado, Annual, 2001-22.
132 U.S. EIA, Electricity, Preliminary Monthly Electric Generator Inventory (based on Form EIA-860M as a supplement to Form EIA-860), updated March 24, 2023.
133 U.S. EIA, Electric Power Monthly, Table 1.14.B. Utility Scale Facility Net Generation from Wind by State, by Sector, Year-to-Date through December 2022 and 2021 (thousand megawatthours).
134 National Renewable Energy Laboratory, Geospatial Data Science, Solar Resource Maps and Data, U.S. Annual Solar GHI, updated February 22, 2018.
135 U.S. EIA, Electric Power Monthly, Table 6.2.B. Net Summer Capacity Using Primarily Renewable Energy Sources and by State, January 2023 and 2022 (Megawatts).
136 U.S. EIA, Electricity, Preliminary Monthly Electric Generator Inventory (based on Form EIA-860M as a supplement to Form EIA-860), updated March 24, 2023.
137 U.S. EIA, "More than half of new U.S. electric-generating capacity in 2023 will be solar" Today in Energy (February 6, 2023).
138 U.S. EIA, Electricity Data Browser, Net generation for all sectors (thousand megawatthours), Colorado, Annual, 2001-21.
139 Energy Smart Colorado, accessed April 19, 2023.
140 Colorado Department of Local Affairs, Renewable Energy, Tax Incentives and Exemptions, accessed April 19, 2023.
141 U.S. Department of Energy, National Renewable Energy Laboratory (NREL), State, Local, & Tribal Governments, Community Solar, accessed April 19, 2023.
142 Bureau of Land Management, Solar Energy Permitting and Program Resources, Colorado, accessed April 19, 2023.
143 Bureau of Land Management, Solar Energy Permitting and Program Resources, Solar Energy Zones, accessed April 20, 2023.
144 U.S. EIA, Electricity, Preliminary Monthly Electric Generator Inventory (based on Form EIA-860M as a supplement to Form EIA-860), updated March 24, 2023.
145 Colorado Energy Office, Reports, Hydropower, Colorado Small Hydropower Handbook, updated October 2015.
146 Colorado Energy Office, Fact Sheet-Energy Recovery Hydropower, accessed April 19, 2023.
147 Colorado Energy Office, Fact Sheet-Small Hydropower Grant and Loan Financing, accessed April 19, 2023.
148 Biomass Magazine, Plants, Eagle Valley Clean Energy, updated November 21, 2022.
149 Colorado State Forest Service, Where Wood Works - Harnessing the Energy of Woody Biomass in Colorado, p.4, accessed April 20, 2023.
150 U.S. EIA, Biomass explained, Landfill gas and biogas, accessed April 26, 2023.
151 Colorado Energy Office, Reports, Renewable Energy, Colorado Market Assessment of Agricultural Anaerobic Digesters, accessed April 20, 2023.
152 NC Clean Energy Technology Center, DSIRE, Sales and Use Tax Exemption for Renewable Energy Equipment, updated October 5, 2021.
153 Colorado State Forest Service, Wood to Energy Program, accessed April 20, 2023.
154 U.S. Department of Energy, Energy Efficiency and Renewable Energy, "Colorado Takes Steps to Expand Geothermal Development," (June 3, 2014).
155 Davis, Graham & Stubbs, "Colorado's Energy-Related Bills in the 2022 Legislative Session," (May 23, 2022).
156 Western Governors' Association, The Heat Beneath Our Feet, accessed April 19, 2023.
157 U.S. Department of the Interior, Energy Efficiency and Renewable Energy, Geothermal Technologies Program Colorado, accessed April 19, 2023.
158 Colorado Geological Survey, Geothermal, accessed April 19, 2023.
159 Colorado State Capitol, Projects, Geothermal, accessed April 19, 2023.
160 U.S. EIA, Electric Power Monthly (February 25, 2022), Table 1.16.B. Utility Scale Facility Net Generation from Geothermal by State, by Sector, Year-to-Date through December 2022 and 2021 (thousand megawatthours).
161 NC Clean Energy Technology Center, DSIRE, Renewable Portfolio Standard, Colorado, updated November 18, 2022.
162 King, Lindsey, "Xcel Is Expanding Energy To Make Its Grid Greener," 5280 (April 1, 2021).
163 Black Hills Energy, Sustainability Report 2021, p.42, accessed April 202, 2023.
164 Colorado Energy Office, Annual Report FY 2021/2022, p.9-10.
165 Colorado Energy Office, Polis Administration: First Term Climate and Clean Energy Action Report, accessed April 19, 2023, p.6.
166 National Conference of State Legislatures, State Renewable Portfolio Standards and Goals, Colorado, updated August 12, 2021.
167 Colorado Governor Jared Polis, Roadmap to 100% Renewable Energy by 2040 and Bold Climate Action, accessed April 19, 2023.
168 Colorado Energy Office, Climate & Energy, GHG Pollution Reduction Roadmap, accessed April 19, 2023.
Other Resources
Energy-Related Regions and Organizations
- Coal Region: Western
- Petroleum Administration for Defense District (PADD): 4
- North American Electric Reliability Corporation (NERC) ERO Enterprise: Regional Entities: Western Electricity Coordinating Council (WECC)
Other Websites
- Colorado Energy Office
- Colorado Department of Regulatory Agencies, Public Utilities Commission
- Colorado Department of Human Services, Low-income Energy Assistance Program (LEAP)
- Colorado Oil and Gas Conservation Commission
- Colorado Energy Office, RENU loan
- Colorado Department of Natural Resources
- University of Colorado Boulder, Energy
- EIA Colorado Flickr Album
- Colorado Energy Office, ReCharge Colorado
- Energy Outreach Colorado
- U.S. Department of the Interior, Bureau of Land Management: Colorado
- Alternative Fuels Data Center, Federal and State Laws and Incentives
- Benefits.Gov, Housing and Public Utilities
- NC Clean Energy Technology Center, Database of State Incentives for Renewables and Efficiency (DSIRE)
- National Association of Regulatory Utility Commissioners (NARUC)
- National Association of State Energy Officials (NASEO)
- National Conference of State Legislatures (NCSL), Research and Policy
- National Renewable Energy Laboratory (NREL), Geospatial Data Science Data and Tools
- U.S. Geological Survey (USGS), Publications
- Interstate Oil and Gas Compact Commission
- Western Area Power Administration
- U.S. Department of Health and Human Services, Administration for Children and Families, Office of Community Services, Low Income Home Energy Assistance Program (LIHEAP)
- U.S. Geological Survey, Maps
- Lawrence Livermore National Laboratory, Energy Flow Charts
- National Renewable Energy Laboratory, State and Local Planning for Energy (SLOPE)
- EIA Natural Gas Storage Dashboard
- University of Colorado Boulder, Renewable & Sustainable Energy Institute
- EIA Energy Disruptions
- U.S. Department of Agriculture (USDA), Rural Development, Energy Programs