Wyoming Quick Facts
- Wyoming produces almost 12 times more energy than it consumes, and it is the second-biggest net energy supplier among the states, after Texas.
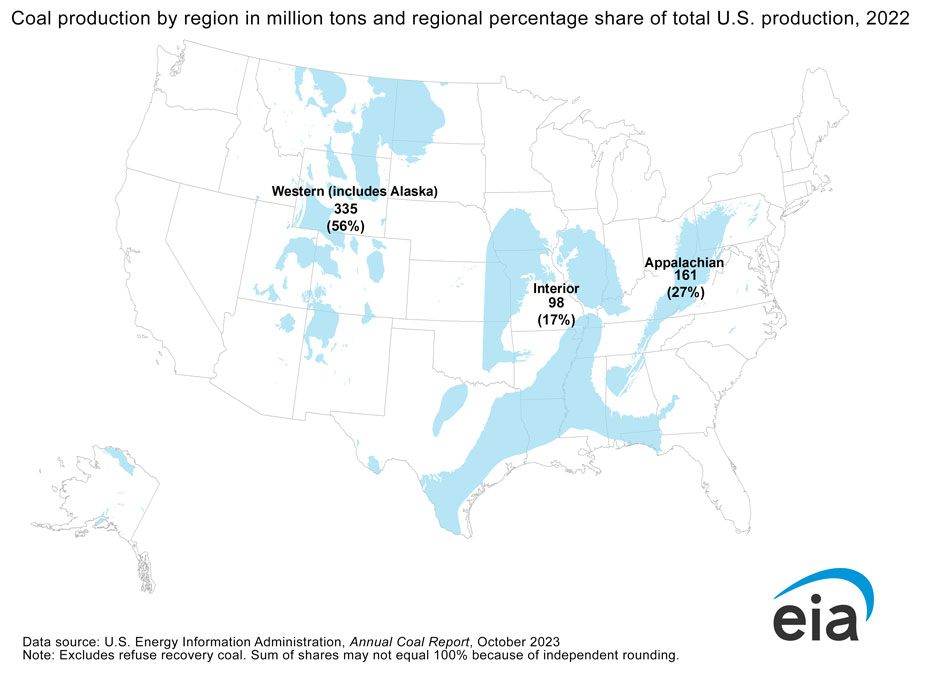
- Wyoming has been the top coal-producing state since 1986, accounting for about two-fifths of all coal mined in the United States in 2022. The state holds nearly two-fifths of U.S. coal reserves at producing mines.
- Wyoming was the eighth-largest crude oil-producing state in the nation in 2022, accounting for 2% of U.S. total crude oil output. The state was the 10th-largest natural gas producer, and accounted for about 3% of U.S. marketed gas production.
- Wyoming’s large energy-producing sector and small population help make the state have the third-highest per capita energy consumption and the second-most energy-intensive state economy, after Louisiana.
- Wind power generation in Wyoming has more than doubled since 2019 and accounted for 22% of the state's total electricity net generation in 2022. The state had just over 3,000 megawatts of wind power generating capacity at the beginning of 2023.
Last Updated: May 18, 2023
Data
Last Update: April 18, 2024 | Next Update: May 16, 2024
| Prices | |||||
|---|---|---|---|---|---|
| Petroleum | Wyoming | U.S. Average | Period | find more | |
| Domestic Crude Oil First Purchase | $ 67.69 /barrel | $ 72.26 /barrel | Jan-24 | ||
| Natural Gas | Wyoming | U.S. Average | Period | find more | |
| City Gate | $ 5.93 /thousand cu ft | $ 4.76 /thousand cu ft | Jan-24 | find more | |
| Residential | $ 10.08 /thousand cu ft | $ 11.82 /thousand cu ft | Jan-24 | find more | |
| Coal | Wyoming | U.S. Average | Period | find more | |
| Average Sales Price | $ 14.84 /short ton | $ 54.46 /short ton | 2022 | ||
| Delivered to Electric Power Sector | W | $ 2.48 /million Btu | Jan-24 | ||
| Electricity | Wyoming | U.S. Average | Period | find more | |
| Residential | 10.86 cents/kWh | 15.45 cents/kWh | Jan-24 | find more | |
| Commercial | 9.52 cents/kWh | 12.68 cents/kWh | Jan-24 | find more | |
| Industrial | 6.97 cents/kWh | 8.10 cents/kWh | Jan-24 | find more | |
| Reserves | |||||
|---|---|---|---|---|---|
| Reserves | Wyoming | Share of U.S. | Period | find more | |
| Crude Oil (as of Dec. 31) | 978 million barrels | 2.4% | 2021 | find more | |
| Expected Future Production of Dry Natural Gas (as of Dec. 31) | 15,005 billion cu ft | 2.5% | 2021 | find more | |
| Expected Future Production of Natural Gas Plant Liquids | 563 million barrels | 2.2% | 2021 | find more | |
| Recoverable Coal at Producing Mines | 3,872 million short tons | 34.3% | 2022 | find more | |
| Rotary Rigs & Wells | Wyoming | Share of U.S. | Period | find more | |
| Natural Gas Producing Wells | 19,641 wells | 4.1% | 2020 | find more | |
| Capacity | Wyoming | Share of U.S. | Period | ||
| Crude Oil Refinery Capacity (as of Jan. 1) | 125,850 barrels/calendar day | 0.7% | 2023 | ||
| Electric Power Industry Net Summer Capacity | 10,244 MW | 0.9% | Jan-24 | ||
| Supply & Distribution | |||||
|---|---|---|---|---|---|
| Production | Wyoming | Share of U.S. | Period | find more | |
| Total Energy | 6,032 trillion Btu | 6.1% | 2021 | find more | |
| Crude Oil | 281 thousand barrels per day | 2.2% | Jan-24 | find more | |
| Natural Gas - Marketed | 1,032,634 million cu ft | 2.6% | 2022 | find more | |
| Coal | 244,382 thousand short tons | 41.1% | 2022 | find more | |
| Total Utility-Scale Net Electricity Generation | Wyoming | Share of U.S. | Period | find more | |
| Total Net Electricity Generation | 3,887 thousand MWh | 1.0% | Jan-24 | ||
| Utility-Scale Net Electricity Generation (share of total) | Wyoming | U.S. Average | Period | ||
| Petroleum-Fired | 0.1 % | 0.4 % | Jan-24 | find more | |
| Natural Gas-Fired | 6.5 % | 42.2 % | Jan-24 | find more | |
| Coal-Fired | 68.6 % | 19.9 % | Jan-24 | find more | |
| Nuclear | 0.0 % | 18.2 % | Jan-24 | find more | |
| Renewables | 23.8 % | 18.8 % | Jan-24 | ||
| Stocks | Wyoming | Share of U.S. | Period | find more | |
| Motor Gasoline (Excludes Pipelines) | 430 thousand barrels | 3.6% | Jan-24 | ||
| Distillate Fuel Oil (Excludes Pipelines) | 686 thousand barrels | 0.7% | Jan-24 | find more | |
| Natural Gas in Underground Storage | 125,596 million cu ft | 1.8% | Jan-24 | find more | |
| Petroleum Stocks at Electric Power Producers | 36 thousand barrels | 0.2% | Jan-24 | find more | |
| Coal Stocks at Electric Power Producers | 3,756 thousand tons | 3.1% | Jan-24 | find more | |
| Fueling Stations | Wyoming | Share of U.S. | Period | ||
| Motor Gasoline | 319 stations | 0.3% | 2021 | ||
| Propane | 10 stations | 0.4% | Mar-24 | ||
| Electric Vehicle Charging Locations | 101 stations | 0.2% | Mar-24 | ||
| E85 | 8 stations | 0.2% | Mar-24 | ||
| Biodiesel, Compressed Natural Gas, and Other Alternative Fuels | 6 stations | 0.2% | Mar-24 | ||
| Consumption & Expenditures | |||||
|---|---|---|---|---|---|
| Summary | Wyoming | U.S. Rank | Period | ||
| Total Consumption | 505 trillion Btu | 42 | 2021 | find more | |
| Total Consumption per Capita | 870 million Btu | 4 | 2021 | find more | |
| Total Expenditures | $ 5,016 million | 46 | 2021 | find more | |
| Total Expenditures per Capita | $ 8,656 | 2 | 2021 | find more | |
| by End-Use Sector | Wyoming | Share of U.S. | Period | ||
| Consumption | |||||
| » Residential | 52 trillion Btu | 0.3% | 2021 | find more | |
| » Commercial | 55 trillion Btu | 0.3% | 2021 | find more | |
| » Industrial | 288 trillion Btu | 0.9% | 2021 | find more | |
| » Transportation | 110 trillion Btu | 0.4% | 2021 | find more | |
| Expenditures | |||||
| » Residential | $ 555 million | 0.2% | 2021 | find more | |
| » Commercial | $ 492 million | 0.2% | 2021 | find more | |
| » Industrial | $ 1,572 million | 0.7% | 2021 | find more | |
| » Transportation | $ 2,398 million | 0.4% | 2021 | find more | |
| by Source | Wyoming | Share of U.S. | Period | ||
| Consumption | |||||
| » Petroleum | 27 million barrels | 0.4% | 2021 | find more | |
| » Natural Gas | 163 billion cu ft | 0.5% | 2022 | find more | |
| » Coal | 22,217 thousand short tons | 4.3% | 2022 | find more | |
| Expenditures | |||||
| » Petroleum | $ 3,195 million | 0.4% | 2021 | find more | |
| » Natural Gas | $ 853 million | 0.3% | 2022 | find more | |
| » Coal | $ 671 million | 2.5% | 2022 | find more | |
| Consumption for Electricity Generation | Wyoming | Share of U.S. | Period | find more | |
| Petroleum | 6 thousand barrels | 0.2% | Jan-24 | find more | |
| Natural Gas | 2,233 million cu ft | 0.2% | Jan-24 | find more | |
| Coal | 1,713 thousand tons | 4.0% | Jan-24 | find more | |
| Energy Source Used for Home Heating (share of households) | Wyoming | U.S. Average | Period | ||
| Natural Gas | 59.0 % | 46.2 % | 2022 | ||
| Fuel Oil | 0.3 % | 3.9 % | 2022 | ||
| Electricity | 22.8 % | 41.3 % | 2022 | ||
| Propane | 11.6 % | 5.0 % | 2022 | ||
| Other/None | 6.3 % | 3.5 % | 2022 | ||
| Environment | |||||
|---|---|---|---|---|---|
| Renewable Energy Capacity | Wyoming | Share of U.S. | Period | find more | |
| Total Renewable Energy Electricity Net Summer Capacity | 3,555 MW | 1.1% | Jan-24 | ||
| Ethanol Plant Nameplate Capacity | -- | -- | 2023 | ||
| Renewable Energy Production | Wyoming | Share of U.S. | Period | find more | |
| Utility-Scale Hydroelectric Net Electricity Generation | 51 thousand MWh | 0.2% | Jan-24 | ||
| Utility-Scale Solar, Wind, and Geothermal Net Electricity Generation | 876 thousand MWh | 1.9% | Jan-24 | ||
| Utility-Scale Biomass Net Electricity Generation | 0 thousand MWh | 0.0% | Jan-24 | ||
| Small-Scale Solar Photovoltaic Generation | 2 thousand MWh | * | Jan-24 | ||
| Fuel Ethanol Production | 0 thousand barrels | 0.0% | 2021 | ||
| Renewable Energy Consumption | Wyoming | U.S. Rank | Period | find more | |
| Renewable Energy Consumption as a Share of State Total | 18.2 % | 15 | 2021 | ||
| Fuel Ethanol Consumption | 785 thousand barrels | 48 | 2021 | ||
| Total Emissions | Wyoming | Share of U.S. | Period | find more | |
| Carbon Dioxide | 54.6 million metric tons | 1.1% | 2021 | ||
| Electric Power Industry Emissions | Wyoming | Share of U.S. | Period | find more | |
| Carbon Dioxide | 38,619 thousand metric tons | 2.3% | 2022 | ||
| Sulfur Dioxide | 25 thousand metric tons | 2.3% | 2022 | ||
| Nitrogen Oxide | 30 thousand metric tons | 2.4% | 2022 | ||
Analysis
Last Updated: May 18, 2023
Overview
Wyoming produces nearly 12 times more energy than it consumes, and it is the second-biggest net energy supplier among the states.
Wyoming is a major producer of coal, crude oil, and natural gas—the fossil fuels that were created from the remains of life in the ancient seas that covered the state many millions of years ago.1,2,3 Wyoming has the smallest population of any state, and only Alaska has fewer residents per square mile.4 The state produces almost 12 times more energy than it consumes, making it the second-biggest net energy supplier among the states after Texas.5 Wyoming is the nation's largest coal-producing state. It also has more oil and natural gas leases on federal lands than any other state.6,7
Wyoming's lowest elevation is more than half a mile above sea level, and its mountain peaks are more than two miles high. The state's mountains, which form part of the Continental Divide, channel weather—and often fierce winds—across wide plains. The high elevations give Wyoming a cool climate overall, but temperatures can be extreme. The state's record high is 116°F in Basin in north-central Wyoming in 1983, and the record low is 66°F below zero in Yellowstone National Park in 1933.8,9 National parks, including Yellowstone and Grand Teton, and national monuments like Devils Tower and Fossil Butte, as well as the Wind River and Bighorn mountain ranges, help make tourism one of Wyoming's major industries.10
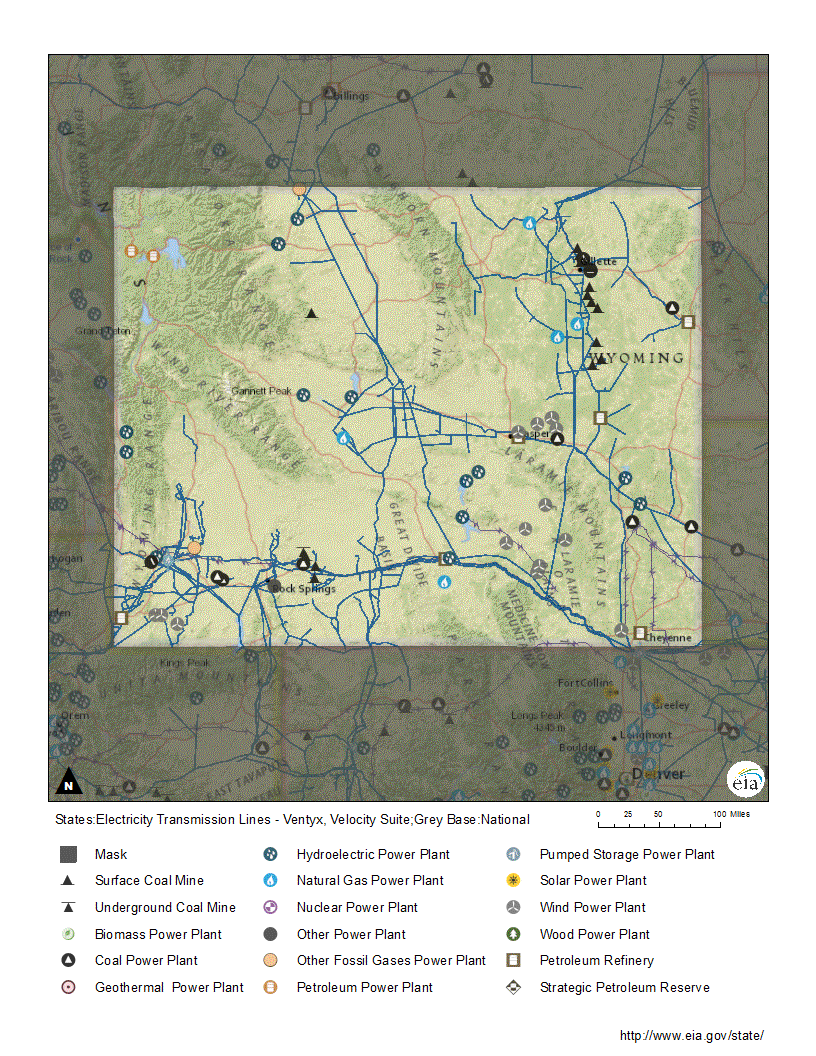
Mining and crude oil and natural gas extraction are major contributors to Wyoming's gross domestic product (GDP) and tax revenue.11,12 Coal is mined primarily in the northeastern part of the state in the Powder River Basin.13 Crude oil and natural gas production is spread across the state, and each fossil fuel is produced alone or together in 21 of Wyoming's 23 counties.14 Mineral royalties, severance payments, and related taxes typically provide a substantial portion of state revenues.15 Although less than one-tenth of the energy produced in Wyoming is consumed there, the state's small population and energy-intensive fossil fuel production help make Wyoming third in the nation in per capita energy consumption and give it the second-most energy-intensive state economy, after Louisiana.16,17,18 Wyoming's industrial sector accounts for about three-fifths of the total energy consumed in the state, the transportation sector consumes about one-fifth, and the commercial and residential sectors each account for about one-tenth.19
Coal
Wyoming has led the nation in coal production since 1986.
Wyoming holds almost two-fifths of U.S. recoverable coal reserves at producing mines.20 The state has led the nation in coal production since 1986, and accounts for two-fifths of all coal mined in the United States.21,22,23 Although Wyoming's annual coal production increased in the last three years, the state's coal output declined by about one-third from 2015 to 2022, as U.S. coal-fired power plants shut down and natural gas-fired and renewable-sourced electricity generation increased.24,25,26,27
Wyoming has 10 major coal fields and 8 of the 10 largest coal mines in the nation.28,29 Seams of the low-sulfur coal, some more than 100 feet thick, lie at shallow depths, allowing large-scale mechanized surface mining in the state. Nearly all of the coal mined in Wyoming is subbituminous, which has a lower heating value than other types of coal. The state accounts for almost nine-tenths of all U.S. production of subbituminous coal.30,31,32 Wyoming also produces some bituminous coal.33 Coal mining began in the state in the mid-1860s when the Union Pacific Railroad arrived.34 Today, most of the mined coal in Wyoming is loaded onto unit trains, which can stretch up to a mile-and-a-half long with about 130 coal cars.35 Wyoming's coal is shipped to more than half the states, and power plants in Texas, Missouri, Wyoming, and Illinois are the biggest users of Wyoming's coal.36 Very little of the state's coal is exported to other countries.37
Petroleum
Wyoming’s per capita consumption of petroleum by barrels is the fourth-highest among the states.
Wyoming holds about 2% of U.S. proved crude oil reserves, and the state is the eighth-largest crude oil producer, accounting for 2% of the nation's total crude oil output.38,39 Wyoming is crossed by pipelines bringing Canadian and Rocky Mountain crude oil to refineries in the Rocky Mountain and Midwest regions. Pipelines also ship refined petroleum products to markets in those regions.40,41,42 The state has four operating petroleum refineries that can process 126,000 barrels of crude oil per calendar day, providing about one-fifth of the refining capacity in the Rocky Mountain region that includes Colorado, Montana, and Utah.43 Wyoming's refineries produce motor gasoline, diesel fuel, jet fuel, and other petroleum products from the state's crude oil and can also process Canadian heavy sour crude oils. Those refineries deliver most of their petroleum products to neighboring states.44,45,46,47 In 2020, the owners of the 48,000 barrel-per-day refinery in Cheyenne shut down the petroleum facility to convert it to produce renewable diesel in 2022.48
Wyoming has the sixth-lowest petroleum consumption among the states. However, because of its small population, high vehicle miles traveled, and large energy-intensive fossil fuel extraction industries, Wyoming has the fourth-highest per capita petroleum consumption by barrels, after Louisiana, Alaska, and Texas.49 The transportation sector consumes about two-thirds of the petroleum used in Wyoming. The industrial sector accounts for most of the rest at about three-tenths, and a small amount is used in the state's residential and commercial sectors.50 Wyoming drivers have the highest per capita gasoline expenditures, which reflect the state's small population, less access to alternative forms of transportation, and high vehicle miles traveled.51 Wyoming does not require ethanol to be blended into its gasoline, although most gasoline sold throughout the state and the rest of the United States contains at least 10% ethanol.52,53
After reaching its highest level in 30 years in 2019, Wyoming's crude oil production fell sharply in 2020 and 2021 in response to the drop in petroleum demand and crude oil prices during the COVID-19 pandemic. The state's crude oil production increased in 2022 to 249,000 barrels per calendar day as the U.S. economy rebounded, petroleum demand increased, and oil prices rose.54,55,56 About three-fifths of Wyoming's crude oil production comes from two counties, Converse and Campbell, located in the Powder River Basin in the northeastern corner of the state.57,58,59 Southwestern Wyoming overlies part of the Green River oil shale, which is a formation rich in kerogen-an organic material found in some sedimentary rocks that can be converted into petroleum liquids when heated. Green River, by some estimates, could be a large source of petroleum if technology were developed to extract the petroleum economically.60,61,62
Natural gas
Wyoming’s natural gas reserves and marketed production are among the top 10 states.
Wyoming ranks among the top 10 states in both natural gas reserves and marketed natural gas production.63,64 Most of the state's natural gas production is on federal lands leased by energy companies.65,66 Production takes place throughout the state, but more than half of Wyoming's natural gas comes from fields in Sublette County in the Green River Basin, located in the state's southwest corner.67,68,69,70 Wyoming has 16 of the nation's 100 largest natural gas fields, including the Pinedale and Jonah fields that rank among the top 10.71 Although natural gas exploration has expanded across the state, including into the Powder River Basin, Wyoming's marketed gas production has decreased by more than half from its 2009 peak, due in part to lower natural gas prices. In 2022, the state's natural gas output fell below 1 trillion cubic feet for the first time since 1999, despite a rise in natural gas prices.72,73,74 In 2018, the federal government approved a large natural gas project in the basin that would drill 3,500 wells over 10 years.75,76,77 The state imposed requirements in 2019 to control the emissions from drilling to help improve air quality.78,79
Wyoming is the third-largest producer of natural gas from coal beds, behind Colorado and New Mexico, but the state's production has steadily declined since its peak in 2009.80 Coalbed methane accounts for about 5% of the state's natural gas production.81
Most natural gas produced in Wyoming leaves the state through interstate pipelines that cross into Utah, Nebraska, Colorado, and Montana, on its way to both Midwest and West Coast markets.82,83 Several interstate pipelines converge at Opal, Wyoming, a major interstate natural gas trading hub.84,85 Some of the natural gas that remains in the state is placed in underground storage. Wyoming has nine natural gas underground storage sites that can hold a combined 156 billion cubic feet of gas, which is almost 2% of U.S. total storage capacity.86,87
Wyoming's natural gas consumption is about one-tenth of the state's natural gas production.88,89 Almost half of the state's natural gas consumption is used in the production, processing, and distribution of natural gas. The state's industrial sector accounts for about one-third of natural gas use, and the residential, commercial, and electric power sectors together account for the remainder. A minor amount of natural gas is consumed as vehicle fuel in the transportation sector.90 Natural gas is Wyoming's most widely used home heating fuel, found in 6 out of 10 households.91
Electricity
In 2022, coal-fired power plants produced about 71% of Wyoming's electricity net generation, down from its peak of 97% in 2003, but still the second-highest share of electricity from coal in any state, except West Virginia. Wind power more than doubled since 2019 and provided 22% of the state's generation in 2022, which was the 11th-highest share of wind power among the states. Natural gas-fired generating units, hydroelectric facilities, and generators fueled by other gases accounted for most of the rest of Wyoming's in-state electricity supply.92,93
Wyoming's small population contributes to it being among the 10 states with the lowest total electricity demand, but it has the second-highest per capita electricity use after North Dakota.94 Wyoming sends almost three-fifths of the electricity it generates out of state.95 Several major interstate transmission line projects are in development to carry more electricity supplies from Wyoming to western population centers.96 Within Wyoming, the industrial sector was the largest electricity consumer in 2022, and accounted for three-fifths of the electricity used in the state. The commercial sector was second and consumed just over one-fifth of the state's electricity, and the residential sector accounted for slightly less than one-fifth of power demand.97 About one out of four Wyoming households relies on electricity as the primary heating source.98 In 2022, Wyoming had the lowest average electricity price.99
The largest U.S. reserves of uranium ore are found in Wyoming.
Wyoming does not have any nuclear power generation, but the state has the largest U.S. reserves of uranium ore that provides the fuel used by nuclear power plants.100,101,102 While there is no conventional uranium mining in Wyoming, the state has three operating in-situ recovery plants that extract uranium from underground by dissolving the ore with a solution and pumping it to the surface where the uranium is recovered.103,104,105,106,107
Renewable energy
About 90% of Wyoming’s renewable electricity generation comes from wind power.
In 2022, renewable energy sources were used to generate 24% of the electricity in Wyoming, with wind power accounting for about nine-tenths of the state's renewable electricity.108 Wyoming has some of the greatest wind resources in the nation, especially in the southeastern corner of the state.109 Sustained winds are funneled through the state's mountain passes and out across the high prairie, which enables Wyoming wind farms to operate at high capacity levels.110,111 At the beginning of 2023, the amount of wind powered-generating capacity installed in Wyoming totaled just over 3,000 megawatts. Another 830 megawatts of capacity is scheduled to come online in 2024.112,113 Several more large wind power projects are in development or under construction, including the 3,000-megawatt Chokecherry-Sierra Madre project with about 900 turbines in south-central Wyoming that will be completed in several phases during 2027-29.114,115,116 There are several large transmission projects in Wyoming to transport the state's wind-generated electricity to other states, including California, that have significant renewable energy requirements.117,118,119,120
Hydroelectric power is the fourth-largest source of Wyoming's in-state generation, accounting for about 2% of the state's total generation and almost one-tenth of the state's renewable generation in 2022.121 The state has 16 hydropower dams. Most of Wyoming's hydroelectric generating units are relatively small, more than 70 years old, and owned by the federal government.122
Wyoming has significant solar resources, but there was little solar generation in the state until 2019. Almost all of the state's solar generation comes from the 92-megawatt Sweetwater Solar farm, which came online at the end of 2018 and is the state's only utility-scale solar power facility.123 The large solar power farm and many customer-sited, small-scale (less than 1 megawatt) solar panels on residential rooftops together provided about 2% of the state's renewable generation in 2022.124,125
Wyoming's geothermal resources are used for direct heating applications, mainly in Yellowstone National Park and Hot Springs State Park. Geothermal energy is also used to heat buildings, water, and some roadways in the state.126,127 Wyoming does not have adequate geothermal resources for commercial electricity generation, but the state does have buildings heated by geothermal heat pumps.128,129
Wyoming does not have a renewable portfolio standard (RPS) or other requirement or goal to have a certain amount of the state's electricity generated from renewable energy sources.130 However, the state provides net metering for residential, commercial, and industrial customers with renewable energy generating systems smaller than 25 kilowatts. Eligible renewable generating systems include solar panels, wind turbines, biomass-fueled generators, and small hydroelectric generators.131
Energy on tribal lands
Wyoming's Wind River Reservation, home to both the Northern Arapaho and the Eastern Shoshone tribes, is the seventh-largest Native American reservation in the United States at about 3,500 square miles.132,133 It is Wyoming's only reservation and occupies most of the Wind River Basin in the west-central area of the state.134,135
The Wind River Reservation has produced crude oil and natural gas for over a century.
The Wind River Reservation has produced crude oil and natural gas for well over a century.136 The state's first oil well was drilled in the Wind River Basin in 1884, south of the reservation's boundary.137 About a half century later, several oil seeps were discovered within the reservation, and crude oil and natural gas production on tribal lands followed.138 Most current crude oil production occurs in the western half of the reservation, while most natural gas production occurs in the eastern half.139 In 2012, the Wyoming tribes and the federal government reached a settlement to resolve underpayment of royalties owed on crude oil and natural gas production from reservation land. The settlement included a $157 million payment to the tribes.140,141 In January 2023, the two tribes reclaimed control of the Steamboat Butte oil field near the reservation's border after not renewing the lease of the field to a private company.142 The tribe took similar action to reclaim control of the Circle Ridge oil and natural gas field in June 2021, after the expiration of a 20-year lease with a different private energy company.143,144
There are two utility-scale electricity generating facilities on the reservation. Both are hydroelectric dams; one has a generation capacity of 17 megawatts and the other has 1.6 megawatts. They are owned and operated by the U.S. Bureau of Reclamation.145
The Wind River Reservation has significant wind energy resources for potential electricity generation, especially along the mountain ridges that border the reservation.146,147 Several areas of the reservation were evaluated for wind projects that could give the two tribes additional sources of energy.148 The Wind River reservation is also one of the top 15 reservations in the nation with the best potential to generate electricity from solar energy resources.149
Endnotes
1 U.S. Energy Information Administration (EIA), State Energy Data System, Table P4, Primary Energy Production Estimates in Physical Units, Ranked by State, 2020.
2 Wyoming State Geological Survey, Wyoming's Energy Resources, accessed April 19, 2023.
3 Wyoming State Geological Survey, Geologic History of Wyoming, accessed April 19, 2023.
4 World Population Review, U.S. States-Ranked by Population 2023.
5 U.S. EIA, State Energy Data System, Production, Table P3, Total Primary Energy Production and Total Energy Consumption Estimates in Trillion Btu, 2020.
6 U.S. EIA, Annual Coal Report 2021 (October 18, 2022), Table 1, Coal Production and Number of Mines by State and Mine Type, 2021 and 2020.
7 U.S. Department of the Interior, Bureau of Land Management, Fiscal Year 2022 Statistics, Table 5, Number of Producing Leases on Federal Lands, accessed April 19, 2023.
8 Coolweather.net, Wyoming Annual Temperatures and Extremes, accessed April 19, 2023.
9 Gray, Steve, "Wicked Wind, Raging Blizzards and Bitter Cold—and That's Just Summer in Wyoming," Community Collaborative Rain, Hail & Snow Network, State Climate Series, accessed April 19, 2023.
10 Wyoming Office of Tourism, The Economic Impact of Travel in Wyoming (January 20, 2023), p. 7.
11 U.S. Bureau of Economic Analysis, Interactive Data, Regional Data, GDP and Personal Income, Annual Gross Domestic Product (GDP) by State, GDP in current dollars, NAICS, Wyoming, All statistics in table, 2021.
12 Petroleum Association of Wyoming, Oil and Gas Facts & Figures 2021, Gross Domestic Production (GDP) by Industry (in millions).
13 Wyoming State Geological Survey, Coal Production & Mining, accessed April 19, 2023.
14 Petroleum Association of Wyoming, Oil and Gas Facts & Figures 2021, Production.
15 State of Wyoming, Department of Revenue, DOR Annual Reports, 2021 Annual Report, Mineral Tax Division, p. 4, 40, 53.
16 U.S. EIA, State Energy Data System, Production, Table P3, Total Primary Energy Production and Total Energy Consumption Estimates in Trillion Btu, 2020.
17 U.S. EIA, State Energy Data System, Table C14, Total Energy Consumption Estimates per Capita by End-Use Sector, Ranked by State, 2020.
18 U.S. EIA, State Energy Data System, Table C10, Total Energy Consumption Estimates, Real Gross Domestic Product (GDP), Energy Consumption Estimates per Real Dollar of GDP, Ranked by State, 2020.
19 U.S. EIA, State Energy Data System, Table C11, Energy Consumption Estimates by End Use Sector, Ranked by State, 2020.
20 U.S. EIA, Annual Coal Report 2021 (October 18, 2022), Table 14, Recoverable Coal Reserves and Average Recovery Percentage at Producing Mines by State, 2021 and 2020.
21 U.S. EIA, Quarterly Coal Report (April 3, 2023), Table 2, Coal production by state.
22 U.S. EIA, Coal Data Browser, Aggregate coal mine production for all coal (short tons), United States, 2001-21.
23 U.S. EIA, State Energy Data Systems, Table PT1. Primary Energy Production Estimates in Physical Units, Wyoming, 1960-2020.
24 U.S. EIA, Coal Data Browser, Aggregate coal mine production for all coal (short tons), Wyoming, 2015-21.
25 U.S. EIA, Quarterly Coal Report (April 3, 2023), Table 2, Coal production by state.
26 U.S. EIA, "Renewable generation surpassed coal and nuclear in the U.S. electric power sector in 2022," Today in Energy (March 27, 2023).
27 U.S. EIA, "Coal will account for 85% of U.S. electric generating capacity retirements in 2022," Today in Energy (January 11, 2022).
28 Wyoming State Geological Survey, Wyoming Coal, accessed April 20, 2023.
29 U.S. EIA, Annual Coal Report 2021 (October 18, 2022), Table 9, Major U.S. Coal Mines, 2021.
30 Wyoming Mining Association, Coal, Origin, accessed April 20, 2023.
31 U.S. EIA, Coal Data Browser, Aggregate coal mine production for subbituminous (short tons), U.S. and Wyoming, 2021.
32 U.S. EIA, Energy Explained, Coal Explained, updated October 19, 2022.
33 U.S. EIA, Coal Data Browser, Aggregate coal mine production for bituminous (short tons), U.S. and Wyoming, 2021.
34 Wyoming State Geological Survey, Wyoming Coal, accessed April 20, 2023.
35 Trainfanatics.com, Wyoming Coal Trains Keep Moving Day and Night!, accessed April 20, 2023.
36 U.S. EIA, Annual Coal Distribution Report 2021 (October 18, 2022), Domestic distribution of U.S. coal by origin state, consumer, destination, and method of transportation, Wyoming, Table OS-28. Domestic Coal Distribution, by Origin State, 2021.
37 U.S. EIA, Annual Coal Distribution Report 2021 (October 18, 2022), Domestic and foreign distribution of U.S. coal by origin state, 2021.
38 U.S. EIA, U.S. Crude Oil and Natural Gas Proved Reserves, Year-end 2021 (December 30, 2022), Table 6, Crude oil plus lease condensate proved reserves, reserves changes, and production, 2021.
39 U.S. EIA, Crude Oil Production, Annual-Thousand Barrels, 2017-22.
40 American Petroleum Institute, Where are the Pipelines? Liquid Pipelines, accessed April 20, 2023.
41 Jeffries, Brian, Update on Natural Gas, NGLs and Crude, Wyoming Pipeline Authority (August 25, 2015), slides 24, 31-33.
42 Wyoming State Geological Survey, Oil & Natural Gas Resources in Wyoming (January 2022), p. 1-2.
43 U.S. EIA, Refinery Capacity Report 2022 (June 21, 2022), Table 1, Number and Capacity of Operable Petroleum Refineries by PAD District and State as of January 1, 2022.
44 U.S. EIA, Refinery Capacity Report 2022 (June 21, 2022), Table 3, Capacity of Operable Petroleum Refineries by State as of January 1, 2022.
45 Silver Eagle Refining, Evanston, Wyoming—Silver Eagle Refining Plant, accessed April 20, 2023.
46 Par Pacific, Wyoming Refining Company, accessed April 20, 2023.
47 Sinclair Oil, Refineries, Sinclair Wyoming Refining Company and Sinclair Casper Wyoming Refining Company, accessed April 20, 2023.
48 HF Sinclair, Renewable Diesel, accessed April 20, 2023.
49 U.S. EIA, State Energy Data System, Table C15, Petroleum Consumption, Total and per Capita, Ranked by State, 2020.
50 U.S. EIA, State Energy Data System, Table F16, Total Petroleum Consumption Estimates, 2020.
51 U.S. EIA, Table E20, Motor Gasoline Price and Expenditure Estimates, Ranked by State, 2020.
52 American Petroleum Institute, U.S. Gasoline Requirements (January 2018).
53 U.S. EIA, "New EPA ruling expands sale of 15% ethanol blended motor gasoline," Today in Energy (July 16, 2019).
54 U.S. EIA, Wyoming Field Production of Crude Oil, Annual, 1981-2022.
55 Cook, Hugh, "Wyoming oil industry is rebounding well after pandemic lows," Wyoming Public Radio (January 26, 2022).
56 Wyoming State Geological Survey, Oil & Natural Gas Resources in Wyoming (January 2023), p. 1-2.
57 U.S. EIA, U.S. Energy Atlas, All Energy Infrastructure and Resources, Wyoming, accessed April 21, 2023.
58 "New wells boost Wyoming's oil production to highest level in 25 years," World Oil (June 6, 2019).
59 Wyoming State Geological Survey, Oil & Natural Gas Resources in Wyoming (January 2023), p. 1-2.
60 U.S. Government Accountability Office, Opportunities and Challenges of Oil Shale Development, GAO-12-740T (May 10, 2012).
61 Maffly, Brian, "Company Wants to Run Utility Corridor Through Public Land for Oil-Shale Mine in Uinta Basin," The Salt Lake Tribune (April 7, 2016).
62 Maffly, Brian, "Major Utah oil-shale project clears ‘tremendous milestone,' but at what cost to the environment?" The Salt Lake Tribune (October 2, 2018).
63 U.S. EIA, U.S. Crude Oil and Natural Gas Proved Reserves, Year-end 2021 (December 30, 2022), Table 10, Proved reserves, reserves changes, and production of natural gas, wet after lease separation, 2021.
64 U.S. EIA, Natural Gas Gross Withdrawals and Production, Marketed Production, Annual-Million Cubic Feet, 2017-22.
65 U.S. Department of the Interior, Bureau of Land Management, Wyoming Oil and Gas Lease Sales, accessed April 21, 2023.
66 U.S. Department of the Interior, Natural Resources Revenue Data, Wyoming, Production, Natural Gas, Oil, 2016-20.
67 Petroleum Association of Wyoming, Oil and Gas Facts & Figures 2021, Production.
68 Wyoming State Geological Survey, Oil & Natural Gas Resources in Wyoming (January 2023), p. 2-4.
69 Wyoming State Geological Survey, Wyoming's Oil & Gas Basins, Greater Green River Basin Geology, accessed April 21, 2023.
70 Enhanced Oil Recovery Institute, Wyoming Oil and Gas Fields, accessed April 25, 2023.
71 U.S. EIA, Top 100 U.S. Oil and Gas Fields (March 2015), p. 8-10.
72 Petroleum Association of Wyoming, Oil and Gas Facts & Figures 2021, Production.
73 U.S. EIA, Natural Gas Gross Withdrawals and Production, Marketed Production, Annual-Million Cubic Feet, Wyoming, 1967-2022.
74 Wyoming State Geological Survey, Oil & Natural Gas Resources in Wyoming (January 2023), A volatile global market, p. 3.
75 Richards, Heather, "Feds approve 3,500-well gas project in western Wyoming," Casper Star-Tribune (August 28, 2018).
76 McKim, Cooper, "NPL Oil And Gas Project Prepares For Drilling Later This Year," Wyoming Public Radio (April 5, 2019).
77 Jonah Energy LLC, Normally Pressured Lance (NPL) Overview, accessed April 21, 2023.
78 Nemec, Richard, "Wyoming DEQ Sets Rules to Lower Oil, Gas Emissions," NGI's Shale Daily (January 2, 2019).
79 Erickson, Camille, "Wyoming regulators call ozone action day for Upper Green River Basin," Casper Star-Tribune (January 20, 2020).
80 U.S. EIA, Natural Gas Gross Withdrawals and Production, Gross Withdrawals from Coalbed Wells, 2016-21.
81 U.S. EIA, Natural Gas Gross Withdrawals and Production, Gross Withdrawals, Gross Withdrawals from Coalbed Wells, Annual-Million Cubic Feet, Wyoming, 2017-22.
82 American Petroleum Institute, Where are the Pipelines? Natural Gas Pipelines, accessed April 21, 2023.
83 U.S. EIA, International and Interstate Movements of Natural Gas by State, Wyoming, 2016-21.
84 A Barrel Full, Opal Natural Gas Market Hub, see links to Ruby and Northwest Gas Pipelines, accessed April 21, 2023.
85 NGI Data, Opal, Opal Description, accessed April 21, 2023.
86 U.S. EIA, Underground Natural Gas Storage Capacity, Total Number of Existing Fields, Wyoming, 2016-21.
87 U.S. EIA, Underground Natural Gas Storage Capacity, Total Storage Capacity, Wyoming, 2016-21.
88 U.S. EIA, Natural Gas Consumption By End-Use, Wyoming, 2017-22.
89 U.S. EIA, Natural Gas Gross Withdrawals and Production, Annual-Million Cubic Feet, Wyoming, 2017-22.
90 U.S. EIA, Natural Gas Consumption By End-Use, Wyoming, 2017-22.
91 U.S. Census Bureau, House Heating Fuel, Table B25040, 2021 ACS 1-Year Estimates Detailed Tables, Wyoming.
92 U.S. EIA, Electricity Data Browser, Net generation for all sectors (thousand megawatthours), Wyoming, Annual, 2001-22.
93 U.S. EIA, Electric Power Monthly (February 2023), Tables 1.3.B, 1.4.B, 1.14.B, 1.17.B.
94 U.S. EIA, State Energy Data System, Table C17, Electricity Retail Sales, Total and Residential, Total and per Capita, Ranked by State, 2020.
95 U.S. EIA, Wyoming Electricity Profile, Table 10, Supply and disposition of electricity, 1990-2021.
96 TransWest Express LLC, Critical grid infrastructure to connect the West, accessed April 21, 2023.
97 U.S. EIA, Electricity Data Browser, Retail sales of electricity (million kilowatthours), Wyoming, Annual, 2019-22.
98 U.S. Census Bureau, House Heating Fuel, Table B25040, 2021 ACS 1-Year Estimates Detailed Tables, Wyoming.
99 U.S. EIA, Electric Power Monthly (February 2023), Table 5.6.B.
100 U.S. Nuclear Regulatory Commission, Operating Nuclear Power Reactors by Location or Name, updated February 28, 2023.
101 U.S. EIA, Domestic Uranium Production Report - Annual, 2021 (May 18, 2022), Table 10, Uranium reserve estimates at the end of 2020 and 2021.
102 Wyoming State Geological Survey, Uranium, accessed April 22, 2024.
103 U.S. EIA, Domestic Uranium Production Report - Annual, 2021 (May 18, 2022), Table 5, U.S. uranium in-situ leach plants by owner, location, capacity and operating status at the end of the year, 2017-21.
104 U.S. EIA, Domestic Uranium Production Report - Quarterly (February 9, 2023), Table 1, Total production of uranium concentrate in the United States.
105 Vanden Berg, Michael, Utah's Energy Landscape, Circular 127, Utah Geological Survey (2020), p. 39.
106 U.S. EIA, Nuclear explained, The nuclear fuel cycle, updated July 12, 2022.
107 Erickson, Camille, "Feds enter new agreement to help Wyoming uranium producers; conservationists have concerns," Casper Star-Tribune (July 23, 2020).
108 U.S. EIA, Electricity Data Browser, Net generation for all sectors (thousand megawatthours), Wyoming, Annual, 2019-22.
109 U.S. Department of Energy, Office of Energy Efficiency & Renewable Energy, WINDExchange, Wind Energy in Wyoming, Maps & Data, accessed April 22, 2023.
110 National Renewable Energy Laboratory, "NREL Study Indicates Economic Potential for Wyoming Wind Transmission to California," Press Release (March 24, 2014).
111 University of Wyoming, "UW Study Determines Wyoming Wind Could Benefit Colorado Economically," Press Release (April 3, 2013).
112 Erickson, Camille, "Energy Journal: Wyoming's wind energy capacity almost doubled in 2020," Casper Star Tribune (February 6, 2021).
113 U.S. EIA, Preliminary Monthly Electric Generator Inventory (based on Form EIA-860M as a supplement to Form EIA-860), Inventory of Operating Generators as of March 2023, Plant State: Wyoming, Technology: Onshore Wind Turbine; Inventory of Planned Generators as of March 2023, Plant State: Wyoming, Technology: Onshore Wind Turbine.
114 Haderlie, Carrie, "Construction resumes on wind project that has generated national attention," The Sheridan Press (May 7, 2021).
115 Power Company of Wyoming, Putting Wind to Work in Carbon County, accessed April 23, 2023.
116 U.S. EIA, Preliminary Monthly Electric Generator Inventory (based on Form EIA-860M as a supplement to Form EIA-860), Inventory of Planned Generators as of March 2023, Plant State: Wyoming, Technology: Onshore Wind Turbine.
117 PacificCorp, Energy Gateway Transmission Expansion, accessed April 23, 2023.
118 TransWest Express LLC, Critical grid infrastructure to connect the West, accessed April 22, 2023.
119 Amusa, Malena, "Duke-American shows off route for the Zephyr Power Transmission Project," Utility Dive (March 28, 2023).
120 Bleizeffer, Dustin, "Greenlit powerlines forecast Wyoming wind energy boom," Energy News Network (June 3, 2022).
121 U.S. EIA, Electricity Data Browser, Net generation for all sectors (thousand megawatthours), Wyoming, Annual, 2019-22.
122 U.S. EIA, Preliminary Monthly Electric Generator Inventory (based on Form EIA-860M as a supplement to Form EIA-860), Inventory of Operating Generators as of March 2023, Plant State: Wyoming, Technology: Conventional Hydroelectric.
123 U.S. EIA, Preliminary Monthly Electric Generator Inventory (based on Form EIA-860M as a supplement to Form EIA-860), Inventory of Operating Generators as of March 2023, Plant State: Wyoming, Technology: Solar Photovoltaic.
124 National Renewable Energy Laboratory, Direct Normal Solar Irradiance, updated February 22, 2018.
125 U.S. EIA, Electricity Data Browser, Net generation for all sectors (thousand megawatthours), Wyoming, Annual, 2019-22.
126 Wyoming State Geological Survey, Geothermal Resources, accessed April 22, 2023.
127 University of Wyoming, Wyoming Renewables, Geothermal, accessed April 22, 2023.
128 Wyoming State Geological Survey, Potential for Geothermal Energy in Wyoming, updated April 20, 2015.
129 U.S. EIA, Electricity Data Browser, Net generation for all sectors (thousand megawatthours), Wyoming, Annual, 2019-22.
130 National Conference of State Legislatures, State Renewable Portfolio Standards and Goals, updated August 13, 2021.
131 NC Clean Energy Technology Center, DSIRE, Net Metering, Wyoming, updated February 21, 2023.
132 U.S. Department of the Interior, Bureau of Indian Affairs, Wind River Agency, accessed April 24, 2023.
133 Wyoming's Wind River Country, Wind River Indian Reservation, accessed April 24, 2023.
134 Mason, Jon P., Sonja K. Sebree, and Thomas L. Quinn, Monitoring-Well Network and Sampling Design for Ground-Water Quality, Wind River Indian Reservation, Wyoming, USGS Scientific Investigations Report 2005-5027, Description of Study Area, updated December 1, 2016.
135 Northern Plains Reservation Aid, Reservations, Wyoming: Wind River Reservation, accessed April 24, 2023.
136 U.S. Department of Energy, Energy Efficiency and Renewable Energy, Wind River Reservation, p. 2, accessed April 24, 2023.
137 Wyoming State Geological Survey, Wind River Basin, Past production, p. 2, updated January 31, 2017.
138 Stilwell, Dean P., Stan W. Davis-Lawrence, and Alfred M. Elser, Reasonable Foreseeable Development Scenario for Oil and Gas, Lander Field Office, Wyoming (February 9, 2009), p. 22.
139 U.S. EIA, U.S. Energy Atlas, All Energy Infrastructure and Resources, Wyoming, accessed April 24, 2023.
140 Zhorov, Irina, "Secretary Salazar Finalizes Indian Trust Settlement," Wyoming Public Radio (November 27, 2012).
141 Zhorov, Irina, "Money Heads to the Wind River Indian Reservation," Wyoming Public Radio (April 17, 2014).
142 Wilde, Elyse and Brian Edward, "Tribes in Wyoming reclaim oil field and, along with it, sovereignty," Tribal Business News (January 29, 2023).
143 "Tribes take over full ownership of oil, gas field," Oil City News (June 7, 2021).
144 Perez, Nate, "Tribes take ownership of reservation oil field," Rocket Miner (June 28, 2021).
145 U.S. EIA, U.S. Energy Atlas, All Energy Infrastructure and Resources, Wyoming, accessed April 24, 2023. U
146 U.S. Department of Energy, Energy Efficiency & Renewable Energy, WINDExchange, Wind Energy in Wyoming, Maps & Data, accessed April 23, 2023.
147 Milbrandt, Anelia, Donna Heimiller, and Paul Schwabe, Techno-Economic Renewable Energy Potential on Tribal Lands (July 2018), National Renewable Energy Laboratory, Figure 2, Wind generation potential by reservation, p. 6.
148 U.S. Department of Energy, Office of Indian Energy Policy and Programs, Shoshone Tribe of the Wind River Reservation-2006 Project.
149 Milbrandt, Anelia, Donna Heimiller, and Paul Schwabe, Techno-Economic Renewable Energy Potential on Tribal Lands (July 2018), National Renewable Energy Laboratory, Figure 4, Photovoltaic generation potential by reservation, p. 9; Table 6, Fifteen Tribal Lands with the Highest Technical Potential for Photovoltaic Electricity Generation, p. 11; Table 9, Fifteen Tribal Lands with the Highest Technical Potential for Concentrating Solar Power Electricity Generation, p. 15.
Other Resources
Energy-Related Regions and Organizations
- Coal Region: Western
- Petroleum Administration for Defense District (PADD): 4
- North American Electric Reliability Corporation (NERC) ERO Enterprise: Regional Entities: Western Electricity Coordinating Council (WECC)
Other Websites
- Wyoming Public Service Commission
- Wyoming Department of Family Services, Housing, Utilities, and Energy Assistance
- Wyoming Energy Authority
- Wyoming Oil and Gas Conservation Commission
- Wyoming Department of Environmental Quality, Land Quality Division
- University of Wyoming, School of Energy Resources
- Wyoming Enhanced Oil Recovery Commission
- Wyoming State Geological Survey
- Enhanced Oil Recovery Institute
- EIA Wyoming Flickr Album
- U.S. Department of the Interior, Bureau of Land Management, Wyoming Oil and Gas Lease Sales
- Western Area Power Administration
- Alternative Fuels Data Center, Federal and State Laws and Incentives
- Benefits.Gov, Housing and Public Utilities
- NC Clean Energy Technology Center, Database of State Incentives for Renewables and Efficiency (DSIRE)
- National Association of Regulatory Utility Commissioners (NARUC)
- National Association of State Energy Officials (NASEO)
- U.S. Department of Energy, Office of Indian Energy Policy and Programs
- National Conference of State Legislatures (NCSL), Research and Policy
- National Renewable Energy Laboratory (NREL), Geospatial Data Science Data and Tools
- U.S. Geological Survey (USGS), Publications
- Interstate Oil and Gas Compact Commission
- Western Interstate Energy Board
- Bonneville Power Administration
- U.S. Department of Health and Human Services, Administration for Children and Families, Office of Community Services, Low Income Home Energy Assistance Program (LIHEAP)
- U.S. Geological Survey, Maps
- Lawrence Livermore National Laboratory, Energy Flow Charts
- National Renewable Energy Laboratory, State and Local Planning for Energy (SLOPE)
- National Renewable Energy Laboratory, Tribal Energy Atlas
- EIA Natural Gas Storage Dashboard
- Western Governors Association
- EIA Energy Disruptions
- U.S. Department of Agriculture (USDA), Rural Development, Energy Programs