Oregon Quick Facts
- In 2022, hydroelectric power accounted for 51% of Oregon's total electricity net generation, and all renewable sources combined produced 70% of the state's total electricity net generation.
- In 2022, wind energy produced 14% of Oregon's total electricity net generation and the state had almost 4,000 megawatts of installed wind-powered generating capacity.
- Oregon is a partner in the West Coast Electric Highway along with California, Washington, and British Columbia, Canada. As of February 2023, there were about 960 public electric vehicle charging stations with a total of more than 2,300 charging ports in service across Oregon.
- Oregon receives more than 90% of the refined petroleum products it uses from the Puget Sound refineries in Washington. Those petroleum products, most of which are transportation fuels, arrive by way of the Olympic Pipeline and by barge at Portland-area terminals.
- Oregon has the only natural gas field in the Pacific Northwest—the Mist field of northwestern Oregon, discovered in 1979. The field no longer has any significant natural gas reserves or production, and it is used primarily for natural gas storage.
Last Updated: March 16, 2023
Data
Last Update: March 21, 2024 | Next Update: April 18, 2024
| Prices | |||||
|---|---|---|---|---|---|
| Petroleum | Oregon | U.S. Average | Period | find more | |
| Domestic Crude Oil First Purchase | -- | $ 71.00 /barrel | Dec-23 | ||
| Natural Gas | Oregon | U.S. Average | Period | find more | |
| City Gate | $ 5.55 /thousand cu ft | $ 4.39 /thousand cu ft | Dec-23 | find more | |
| Residential | $ 16.05 /thousand cu ft | $ 12.94 /thousand cu ft | Dec-23 | find more | |
| Coal | Oregon | U.S. Average | Period | find more | |
| Average Sales Price | -- | $ 54.46 /short ton | 2022 | ||
| Delivered to Electric Power Sector | -- | $ 2.48 /million Btu | Dec-23 | ||
| Electricity | Oregon | U.S. Average | Period | find more | |
| Residential | 12.56 cents/kWh | 15.73 cents/kWh | Dec-23 | find more | |
| Commercial | 10.08 cents/kWh | 12.39 cents/kWh | Dec-23 | find more | |
| Industrial | 6.89 cents/kWh | 7.66 cents/kWh | Dec-23 | find more | |
| Reserves | |||||
|---|---|---|---|---|---|
| Reserves | Oregon | Share of U.S. | Period | find more | |
| Crude Oil (as of Dec. 31) | -- | -- | 2021 | find more | |
| Expected Future Production of Dry Natural Gas (as of Dec. 31) | -- | -- | 2021 | find more | |
| Expected Future Production of Natural Gas Plant Liquids | -- | -- | 2021 | find more | |
| Recoverable Coal at Producing Mines | -- | -- | 2022 | find more | |
| Rotary Rigs & Wells | Oregon | Share of U.S. | Period | find more | |
| Natural Gas Producing Wells | 10 wells | * | 2020 | find more | |
| Capacity | Oregon | Share of U.S. | Period | ||
| Crude Oil Refinery Capacity (as of Jan. 1) | 0 barrels/calendar day | 0.0% | 2023 | ||
| Electric Power Industry Net Summer Capacity | 17,395 MW | 1.5% | Dec-23 | ||
| Supply & Distribution | |||||
|---|---|---|---|---|---|
| Production | Oregon | Share of U.S. | Period | find more | |
| Total Energy | 428 trillion Btu | 0.4% | 2021 | find more | |
| Crude Oil | -- | -- | Dec-23 | find more | |
| Natural Gas - Marketed | 13 million cu ft | * | 2022 | find more | |
| Coal | -- | -- | 2022 | find more | |
| Total Utility-Scale Net Electricity Generation | Oregon | Share of U.S. | Period | find more | |
| Total Net Electricity Generation | 5,000 thousand MWh | 1.4% | Dec-23 | ||
| Utility-Scale Net Electricity Generation (share of total) | Oregon | U.S. Average | Period | ||
| Petroleum-Fired | NM | 0.3 % | Dec-23 | find more | |
| Natural Gas-Fired | 41.0 % | 42.2 % | Dec-23 | find more | |
| Coal-Fired | 0.0 % | 16.2 % | Dec-23 | find more | |
| Nuclear | 0.0 % | 19.9 % | Dec-23 | find more | |
| Renewables | 58.9 % | 20.9 % | Dec-23 | ||
| Stocks | Oregon | Share of U.S. | Period | find more | |
| Motor Gasoline (Excludes Pipelines) | 54 thousand barrels | 0.4% | Dec-23 | ||
| Distillate Fuel Oil (Excludes Pipelines) | 1,035 thousand barrels | 1.0% | Dec-23 | find more | |
| Natural Gas in Underground Storage | 33,938 million cu ft | 0.4% | Dec-23 | find more | |
| Petroleum Stocks at Electric Power Producers | 51 thousand barrels | 0.2% | Dec-23 | find more | |
| Coal Stocks at Electric Power Producers | 0 thousand tons | 0.0% | Dec-23 | find more | |
| Fueling Stations | Oregon | Share of U.S. | Period | ||
| Motor Gasoline | 968 stations | 0.9% | 2021 | ||
| Propane | 42 stations | 1.7% | Feb-24 | ||
| Electric Vehicle Charging Locations | 1,160 stations | 1.9% | Feb-24 | ||
| E85 | 5 stations | 0.1% | Feb-24 | ||
| Biodiesel, Compressed Natural Gas, and Other Alternative Fuels | 40 stations | 1.4% | Feb-24 | ||
| Consumption & Expenditures | |||||
|---|---|---|---|---|---|
| Summary | Oregon | U.S. Rank | Period | ||
| Total Consumption | 1,045 trillion Btu | 32 | 2021 | find more | |
| Total Consumption per Capita | 246 million Btu | 36 | 2021 | find more | |
| Total Expenditures | $ 15,234 million | 29 | 2021 | find more | |
| Total Expenditures per Capita | $ 3,579 | 38 | 2021 | find more | |
| by End-Use Sector | Oregon | Share of U.S. | Period | ||
| Consumption | |||||
| » Residential | 257 trillion Btu | 1.2% | 2021 | find more | |
| » Commercial | 193 trillion Btu | 1.1% | 2021 | find more | |
| » Industrial | 290 trillion Btu | 0.9% | 2021 | find more | |
| » Transportation | 304 trillion Btu | 1.1% | 2021 | find more | |
| Expenditures | |||||
| » Residential | $ 3,092 million | 1.1% | 2021 | find more | |
| » Commercial | $ 2,061 million | 1.0% | 2021 | find more | |
| » Industrial | $ 2,049 million | 0.9% | 2021 | find more | |
| » Transportation | $ 8,032 million | 1.3% | 2021 | find more | |
| by Source | Oregon | Share of U.S. | Period | ||
| Consumption | |||||
| » Petroleum | 65 million barrels | 0.9% | 2021 | find more | |
| » Natural Gas | 279 billion cu ft | 0.9% | 2022 | find more | |
| » Coal | 48 thousand short tons | * | 2022 | find more | |
| Expenditures | |||||
| » Petroleum | $ 9,075 million | 1.2% | 2021 | find more | |
| » Natural Gas | $ 2,121 million | 0.8% | 2022 | find more | |
| » Coal | $ 5 million | * | 2022 | find more | |
| Consumption for Electricity Generation | Oregon | Share of U.S. | Period | find more | |
| Petroleum | NM | NM | Dec-23 | find more | |
| Natural Gas | 14,161 million cu ft | 1.4% | Dec-23 | find more | |
| Coal | 0 thousand tons | 0.0% | Dec-23 | find more | |
| Energy Source Used for Home Heating (share of households) | Oregon | U.S. Average | Period | ||
| Natural Gas | 37.0 % | 46.2 % | 2022 | ||
| Fuel Oil | 1.2 % | 3.9 % | 2022 | ||
| Electricity | 53.9 % | 41.3 % | 2022 | ||
| Propane | 2.1 % | 5.0 % | 2022 | ||
| Other/None | 5.8 % | 3.5 % | 2022 | ||
| Environment | |||||
|---|---|---|---|---|---|
| Renewable Energy Capacity | Oregon | Share of U.S. | Period | find more | |
| Total Renewable Energy Electricity Net Summer Capacity | 13,605 MW | 4.1% | Dec-23 | ||
| Ethanol Plant Nameplate Capacity | 40 million gal/year | 0.2% | 2023 | ||
| Renewable Energy Production | Oregon | Share of U.S. | Period | find more | |
| Utility-Scale Hydroelectric Net Electricity Generation | 2,308 thousand MWh | 11.9% | Dec-23 | ||
| Utility-Scale Solar, Wind, and Geothermal Net Electricity Generation | 557 thousand MWh | 1.1% | Dec-23 | ||
| Utility-Scale Biomass Net Electricity Generation | 82 thousand MWh | 2.0% | Dec-23 | ||
| Small-Scale Solar Photovoltaic Generation | 19 thousand MWh | 0.4% | Dec-23 | ||
| Fuel Ethanol Production | 717 thousand barrels | 0.2% | 2021 | ||
| Renewable Energy Consumption | Oregon | U.S. Rank | Period | find more | |
| Renewable Energy Consumption as a Share of State Total | 42.9 % | 3 | 2021 | ||
| Fuel Ethanol Consumption | 3,799 thousand barrels | 30 | 2021 | ||
| Total Emissions | Oregon | Share of U.S. | Period | find more | |
| Carbon Dioxide | 38.5 million metric tons | 0.8% | 2021 | ||
| Electric Power Industry Emissions | Oregon | Share of U.S. | Period | find more | |
| Carbon Dioxide | 7,874 thousand metric tons | 0.5% | 2022 | ||
| Sulfur Dioxide | 4 thousand metric tons | 0.4% | 2022 | ||
| Nitrogen Oxide | 16 thousand metric tons | 1.3% | 2022 | ||
Analysis
Last Updated: March 16, 2023
Overview
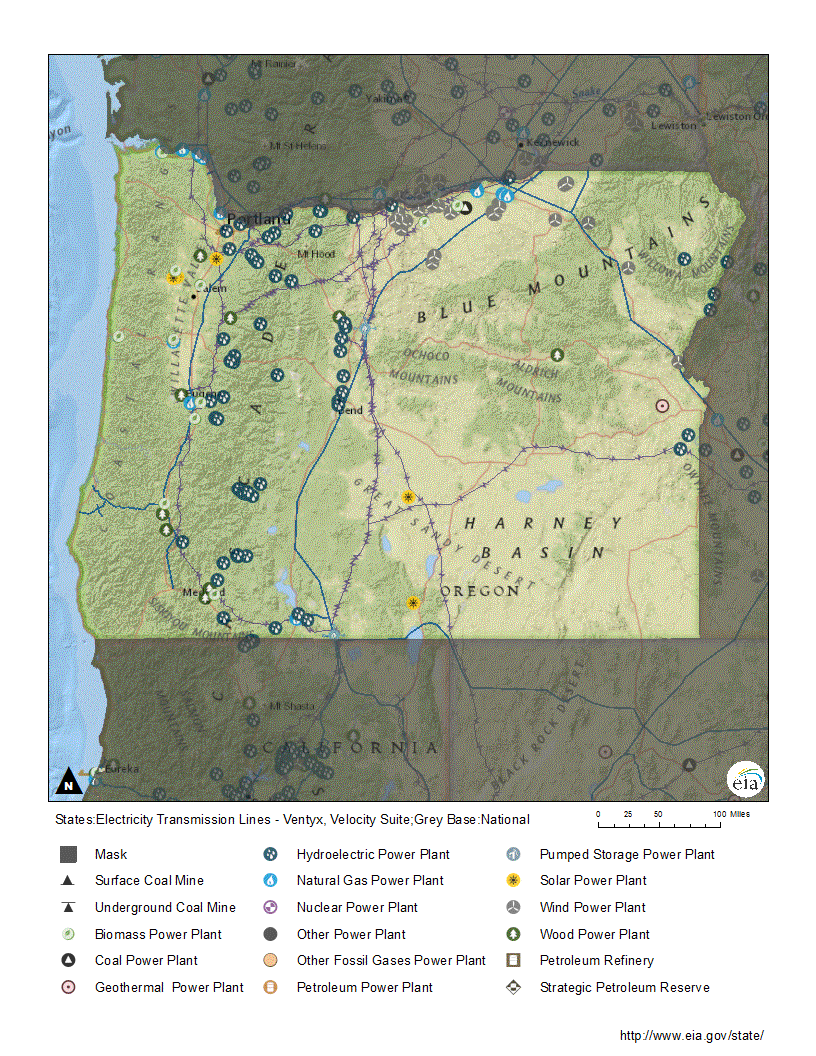
Oregon sits on the U.S. Pacific Coast between the more populous states of Washington and California.1 The Columbia River forms much of Oregon's northern border with Washington. The river cuts through both the Cascade Mountain Range and the Coastal Ranges, forming the Columbia Gorge, an area of high wind energy potential.2,3 Large dams along the Columbia River produce most of the hydroelectric power in Oregon and throughout the Pacific Northwest. High annual rainfall in the western part of the state coupled with runoff from the snowpack in the state's mountains make it possible for Oregon to generate substantial amounts of hydropower.4,5 Mild temperatures and abundant rainfall in western Oregon also contribute to rapid tree growth, which, along with agricultural residues, are ample sources of biomass for power generation.6,7 The Cascade Mountains are volcanic in origin, and in addition to containing the nation's deepest lake, they have the state's greatest geothermal resources. East of the Cascades is the Columbia Plateau, which, like the Basin and Range area along Oregon's southern border with California, is more arid than the areas west of the mountains.8 The high desert country and uplands of southern and eastern Oregon are promising sites for wind, solar, and geothermal energy development.9,10,11 Oregon has only minor fossil energy reserves and no nuclear power reactors.12,13,14
Energy use per capita in Oregon is less than in nearly three-fourths of the states.15 In 2020, the transportation sector accounted for nearly three-tenths of the state's total energy consumption. The industrial sector used slightly less and was Oregon's second-largest energy consumer.16 Although Oregon's agriculture, food processing, and forestry activities, including the manufacture of forest products, are energy-intensive, most of the state's gross domestic product (GDP) comes from non-energy-intensive service-providing businesses. Computers and electronic products accounted for more than two-fifths of Oregon's manufacturing GDP, and the industrial sector's per capita energy consumption was less than in almost two-thirds of the states.17,18 The residential sector accounted for one-fourth of the state's total energy consumption, and the commercial sector used about one-fifth.19 In part because most of Oregon's population centers are in mild climate zones in the Willamette Valley and along the Pacific Coast west of the Cascades, the state's residential sector energy use per capita ranked 45th in the nation in 2020.20,21,22
Electricity
Hydroelectric power is the largest source of the electricity generated in Oregon.
Hydroelectric power typically provides more than half of Oregon's in-state total electricity net generation. However, because of abnormally dry weather and drought in recent years, hydroelectric power supplied less than half of Oregon's in-state total electricity generation in 2019 and 2021.23 Nevertheless, the state is one of the four largest hydroelectric power producers in the nation. In 2022, hydroelectric power accounted for 51% of Oregon's total electricity generation, and the state was the nation's second-largest hydroelectric power producer, after Washington.24,25 Oregon's four largest electricity generating facilities by capacity—John Day, The Dalles, Bonneville, and McNary—are on the Columbia River and are all at federally owned and operated dams. Those power plants collectively account for two-thirds of the generating capacity from the 10 largest power plants in the state. The Bonneville Power Administration, a federal power marketing administration within the Department of Energy, sells the power generated to public utilities, private utilities, and industry.26,27 Many smaller hydroelectric plants along Oregon's rivers also supply the state with power. Oregon has nearly 100 hydropower facilities.28
Natural gas fuels the second-largest share of Oregon's electricity generation. In 2022, natural gas-fired power plants provided 30% of the state's total net generation. Nonhydroelectric renewable resources—wind, solar, biomass, and geothermal power—provide almost all the rest of Oregon's total generation, 19% in 2022. Two decades ago, coal fueled about 10% of Oregon's in-state net generation, but, by 2021, Oregon's only coal-fired power plant had closed, and coal no longer fueled any in-state generation.29,30 There are no commercial nuclear power plants in the state.31 Oregon's only nuclear power plant shut down after cracks in the steam tubes were detected in 1992. The plant was decommissioned and demolished in 2006.32
Oregon's total electricity sales per capita are near the U.S. average.33 The residential sector, where about half the households heat with electricity, accounted for almost two-fifths of Oregon's electricity sales in 2022.34 The commercial sector accounted for about three-tenths and the industrial sector used three-tenths. The transportation sector consumed a minimal amount of electricity for rail use.35
In every year since 2007, Oregonians used less electricity than the state's power plants generated and the excess power went to other states by way of the Western Interconnection—one of North America's principal power grids.36 The Western Interconnection reaches from western Canada down to Baja California in Mexico and stretches from the Pacific Ocean eastward across the Rocky Mountains to the Great Plains.37 Major transmission lines of the Western Interconnection link Oregon's electricity grid to California's grid, allowing for large interstate electricity transfers between the Pacific Northwest and the Southwest.38 Although originally designed to transmit inexpensive hydroelectricity south to California, the flow sometimes reverses to bring solar power to the Pacific Northwest.39
Oregon partnered with Washington, California, and British Columbia, Canada, to create the West Coast Electric Highway corridor, a network of public charging stations for electric vehicles located every 25 to 50 miles along Interstate 5 and other major roads in the Pacific Northwest. It is part of the West Coast Green Highway system that spans more than 1,300 miles from British Columbia to Baja, Mexico.40,41 As of February 2023, there were about 950 public electric vehicle charging stations with more than 2,200 charging ports in service across Oregon.42 As of the beginning of 2022, Oregon had more than 30,000 registered all-electric vehicles.43
Renewable energy
In 2022, wind power accounted for 14% of Oregon’s total in-state electricity generation.
In 2022, renewable energy resources, led by hydroelectric power, accounted for about 70% of Oregon's total in-state electricity net generation. Hydroelectric power also accounted for more than seven-tenths of the state's renewable generation.44 However, electricity generation from nonhydroelectric renewable sources has more than doubled since 2011. Wind accounted for the largest share of the increased generation.45 In 2022, wind power accounted for 14% of Oregon's total in-state electricity generation.46 Most of the state's wind farms are along Oregon's northern border near the Columbia Gorge and in eastern Oregon's Blue Mountains.47 By December 2022, Oregon had almost 4,000 megawatts of wind capacity.48 A 200-megawatt wind farm in northern Oregon came online in 2022, and a 600 megawatt combined wind and solar farm is in development and is scheduled to come online in 2025.49,50
In 2022, solar energy, including small-scale (less than 1 megawatt) solar installations, supplied about 3% of Oregon's total electricity generation, surpassing the contribution from biomass for the second year in a row. All of Oregon's solar powered electricity generation is photovoltaic (PV). The state's first utility-scale (1 megawatt or larger) solar facilities came online in late 2011.51 Between 2014 and 2016, the largest share of Oregon's solar generation came from customer-sited rooftop and other small-scale solar power installations.52 Several larger utility-scale solar projects have come online since then. A 56-megawatt solar PV facility began operations in October 2017, and the state's first solar PV facility with greater than 70 megawatts of capacity came online in 2021.53 There are additional larger solar PV projects in development, and almost 2,000 megawatts of additional solar PV capacity is scheduled to come online between 2023 and 2025.54
Biomass generates most of the rest of Oregon's renewable-sourced electricity—almost 2% of the state's total net generation in 2022.55 Wood and wood waste fuel most of the state's biomass generation, but landfill gas, municipal solid waste, and other biomass-fueled facilities also contribute.56,57 Forests covers almost half of the state, and many industrial facilities in western Oregon use woody biomass to generate electricity.58,59 Biomass is also a thermal energy source, and some commercial facilities in the state, including schools and hospitals, use wood for space heating.60 About 1 in 20 Oregon households heat with wood.61 The state has six operating wood pellet manufacturing facilities with a combined production capacity of almost 370,000 tons per year, or about 3% of the nation's total. Wood pellets are used for space heating as well as for electricity generation.62
Although geothermal energy accounts for less than 1% of Oregon's net generation, the state has some of the nation's best geothermal resources, and it is one of only seven states with utility-scale generation from geothermal energy.63,64,65 A U.S. Department of Energy study ranked the state's geothermal potential third in the nation, after Nevada and California. Oregon's Cascade Mountains are an active volcanic region and, along with other high-temperature geothermal areas in the state, have an estimated 2,200 megawatts of electricity generating potential.66,67 Oregon has two geothermal power plants, but only one is operational. The state's larger geothermal power plant, built in 2012, is active and has about 18 megawatts of capacity. The second and much smaller geothermal power plant, with a capacity of about 2 megawatts, has been offline since 2017.68 Oregon residents have used low-to-moderate temperature geothermal resources for more than a century in direct heat applications. Almost the entire state east of the Cascade Range has ample low- to mid-temperature geothermal resources, and there are more than 2,000 thermal wells and springs in Oregon that furnish direct heat to buildings, communities, and other facilities in the state.69,70
Oregon is working on tapping its marine and hydrokinetic—wave and tidal—energy resources. A U.S. Department of Energy-funded investigation led by Oregon State University has two marine test sites off the coast of Newport, Oregon. The first, PacWave North, is a stand-alone test site for small-scale technologies. A second site, PacWave South, will be the first full-scale grid-connected, wave energy conversion technology test facility in the United States.71
Oregon's renewable energy portfolio standard (RPS) requires that at least 50% of the electricity sold in Oregon come from renewable-sourced generation by 2040.72 In 2021, Oregon's legislature passed the Clean Energy Standard (CES), which set clean energy targets. The CES calls for a reduction in greenhouse gas emissions of 80% of baseline by 2030, 90% by 2035, and 100% by 2040. The baselines for utilities are calculated from the annual average emissions associated with electricity sold in Oregon in 2010, 2011 and 2012.73
Natural gas
Oregon has the only natural gas field in the Pacific Northwest.
Oregon has the only natural gas field in the Pacific Northwest—the Mist field in northwestern Oregon, discovered in 1979.74 Although it produces only a small fraction of the U.S. total, Mist Field production reached a high of 4.6 billion cubic feet of natural gas per year in the mid-1980s. Annual natural gas production from the field declined to 205 million cubic feet in 2021.75 The field no longer has any significant natural gas reserves or production, and it is used primarily for natural gas storage.76,77 Mist Field contains several underground natural gas storage reservoirs.78 Oregon's natural gas storage reservoirs have a combined capacity of about 36 billion cubic feet.79,80 Typically, natural gas is put into storage during warmer months, when prices and demand are low, and removed from storage reservoirs during colder months to meet peak customer heating demand. However, natural gas withdrawals occur at other times to meet the needs of electricity suppliers as they balance intermittent generation from renewable energy resources, particularly wind.81
Natural gas supplies enter Oregon by way of interstate pipelines, primarily from western Canada through Washington and from domestically produced natural gas that arrives through Nevada and Idaho. Almost all of the natural gas that enters Oregon continues on to California markets.82,83 Several Oregon liquefied natural gas (LNG) import/export terminal projects have been proposed since 2004, but none have been built.84
Oregon's total and per capita natural gas consumption is less than almost three-fourths of the states.85 The electric power sector receives about half of the natural gas delivered to Oregon consumers. The industrial sector accounts for about one-fifth of state consumption. The residential sector, where almost three in five Oregon households use natural gas as their primary energy source for home heating, accounts for nearly one-fifth of natural gas deliveries, and the commercial sector uses almost all the rest. The transportation sector uses a very small amount of compressed natural gas as vehicle fuel.86,87
Petroleum
Oregon receives about 90% of its refined petroleum products from Washington’s Puget Sound refineries.
Oregon does not have any crude oil reserves or production and its only crude oil refinery closed in 2008.88,89,90 The Puget Sound refineries in the state of Washington provide about 90% of the refined petroleum products, such as motor gasoline, distillate fuel oil (diesel), and jet fuel, used in Oregon. Those petroleum products arrive in the state by way of the Olympic Pipeline and by barge at seven Portland-area terminals.91 Refineries in Utah also send refined petroleum products to Oregon, and some petroleum products arrive by tanker or rail from California and Canada.92 Exports of Canadian and North Dakota crude oil move through the Portland port for shipment overseas.93
In 2020, the transportation sector used 86% of the petroleum consumed in Oregon, and almost three-fifths of that was used as motor gasoline.94,95 The industrial sector accounted for 9% of state petroleum consumption and the commercial sector used about 4%. The residential sector, where only about 1 in 30 households use petroleum products—including fuel oil, kerosene, and propane—for home heating, accounted for less than 2%.96,97
Oregon's renewable fuel standard requires, with few exceptions, that motor gasoline sold in the state contain a minimum of 10% fuel ethanol.98 There is one fuel ethanol production plant in Oregon, near the Washington border on the Columbia River.99,100 That plant produces enough fuel ethanol annually to meet about one-fifth of the state's needs.101,102 Additional fuel ethanol supplies primarily come by rail from the Midwest.103 Diesel fuel sold in Oregon must be blended with at least 5% biodiesel.104 Oregon has one biodiesel plant, in Portland, that collects used cooking oils and grease from restaurants and other businesses.105 In 2020, biodiesel consumption in the state was more than six times greater than state production.106,107
Coal
Coal was mined in southwest Oregon from the mid-19th century until the 1920s, and the state has few remaining coal reserves. There are no active commercial coal mines in Oregon today.108,109,110 Limited amounts of coal, shipped by rail from the Powder River Basin in Wyoming, fueled Oregon's only coal-fired power plant until October 2020, when the power plant closed.111 In 2021, less than 60,000 tons of coal arrived from Utah for use at industrial plants in Oregon.112
Endnotes
1 U.S. Census Bureau, State Population Totals and Components of Change: 2020-2022, Annual Estimates of the Resident Population for the United States, Regions, States, the District of Columbia, and Puerto Rico: April 1, 2020 to July 1, 2022.
2 Geology.com, Oregon Map Collection, Oregon Rivers Map, accessed February 17, 2023.
3 Sharp, Justin, and Clifford F. Mass, "Columbia Gorge Gap Winds: Their Climatological Influence and Synoptic Evolution," Weather and Forecasting, Volume 19, Issue 6 (December 2004), p. 970-992.
4 Western Regional Climate Center, Climate of Oregon, accessed February 17, 2023.
5 Oregon Department of Energy, Energy in Oregon, Hydropower, Hydropower in Oregon, accessed February 17, 2023.
6 Western Regional Climate Center, Climate of Oregon, Climate and the Economy, accessed February 17, 2023.
7 Oregon Department of Energy, Energy in Oregon, Bioenergy, accessed February 17, 2023.
8 NETSTATE, Oregon, The Geography of Oregon, updated February 25, 2016.
9 U.S. Department of Energy, Office of Energy Efficiency and Renewable Energy, WINDExchange, Wind Energy in Oregon, Oregon 80-Meter Wind Resource Map, accessed February 17, 2023.
10 Roberts, Billy J., Global Horizontal Solar Irradiance, National Renewable Energy Laboratory (February 22, 2018).
11 U.S. Department of Energy, Energy Efficiency and Renewable Energy, Geothermal Technologies Program, Oregon, DOE/GO-102004-2036 (February 2005), p. 1.
12 U.S. Energy Information Administration (EIA), Oregon Profile Data, Supply and Distribution, accessed February 17, 2023.
13 Brownfield, Michael E., "Oregon's coal and its economic future," Oregon Geology, Volume 43, Number 5 (May 1981).
14 U.S. Nuclear Regulatory Commission, Oregon, updated March 9, 2021.
15 U.S. EIA, State Energy Data System, Table C14, Total Energy Consumption Estimates per Capita by End-Use Sector, Ranked by State, 2020.
16 U.S. EIA, State Energy Data System, Table C1, Energy Consumption Overview: Estimates by Energy Source and End-Use Sector, 2020.
17 U.S. Bureau of Economic Analysis, Tools, Regional Data, GDP and Personal Income, Annual Gross Domestic Product (GDP) by State, GDP in Current Dollars, Oregon, All statistics in table, 2020, 2021.
18 U.S. EIA, State Energy Data System, Table C14, Total Energy Consumption Estimates per Capita by End-Use Sector, Ranked by State, 2020.
19 U.S. EIA, State Energy Data System, Table C1, Energy Consumption Overview: Estimates by Energy Source and End-Use Sector, 2020.
20 U.S. Census Bureau, 2010 Census: Oregon Profile, Population Density by Census Tract.
21 Western Regional Climate Center, Climate of Oregon, accessed February 17, 2023.
22 U.S. EIA, State Energy Data System, Table C14, Total Energy Consumption Estimates per Capita by End-Use Sector, Ranked by State, 2020.
23 National Integrated Drought Information System, Current U.S. Drought Monitor Conditions for Oregon, February 17, 2023.
24 U.S. EIA, Electricity Data Browser, Net generation for all sectors, Oregon, All fuels, Conventional hydroelectric, Small-scale solar photoelectric, Annual, 2001-22.
25 U.S. EIA, Electricity Data Browser, Net generation for all sectors, Geography (Check all), Conventional hydroelectric, Annual, 2020-22.
26 U.S. EIA, Oregon Electricity Profile 2021, Tables 2A, 2B.
27 Bonneville Power Administration, BPA Facts, DOE/BP-5172 (August 2021).
28 Oregon Department of Energy, Energy in Oregon, Hydropower, Hydropower in Oregon, accessed February 17, 2023.
29 U.S. EIA, Electricity Data Browser, Net generation for all sectors, Oregon, Fuel Type (Check all), Annual, 2001-22.
30 Oregon Department of Energy, 2022 Biennial Energy Report (November 2022), Energy by the Numbers, p. 4.
31 U.S. Nuclear Regulatory Commission, Oregon, updated March 9, 2021.
32 Oregon Department of Energy, Trojan Nuclear Site Spent Fuel Storage, February 17, 2023.
33 U.S. EIA, State Energy Data System, Table C17, Electricity Retail Sales, Total and Residential, Total and per Capita, Ranked by State, 2020.
34 U.S. Census Bureau, Oregon, Table B25040, House Heating Fuel, 2021 American Community Survey 1-Year Estimates.
35 U.S. EIA, Electricity Data Browser, Retail sales of electricity, Oregon, All sectors, Residential, Commercial, Industrial, Transportation, Other, Annual, 2022.
36 U.S. EIA, Oregon Electricity Profile 2021, Table 10, Supply and disposition of electricity, 1990 through 2021.
37 U.S. Department of Energy, Office of Electricity Delivery and Energy Reliability, Learn More About Interconnections, Western Interconnection, accessed February 17, 2023.
38 Bonneville Power Administration, Factsheet, Celilo Converter Station, DOE/BP-4757 (April 2016).
39 Harrison, John, Pacific Northwest-Southwest Intertie, Oregon Encyclopedia, accessed February 17, 2023.
40 Lundahl, Erika, "The West Coast Electric Highway Enables Zero Emission Road Trips," Yes! (July 20, 2018).
41 West Coast Green Highway, West Coast Electric Highway, accessed February 17, 2023.
42 U.S. Department of Energy, Energy Efficiency and Renewable Energy, Alternative Fuels Data Center, Electric Vehicle Charging Station Locations, Oregon Electric, Public Access, accessed February 17, 2023.
43 U.S. Department of Energy, Energy Efficiency and Renewable Energy, Alternative Fuels Data Center, Electric Vehicle Registrations by State (June 2022).
44 U.S. EIA, Electricity Data Browser, Net generation for all sectors, Oregon, Fuel Type (Check all), Annual, 2022.
45 U.S. EIA, Electricity Data Browser, Net generation for all sectors, Oregon, Conventional hydroelectric, Other renewables, Wind, Annual, 2011-22.
46 U.S. EIA, Electricity Data Browser, Net generation for all sectors, Oregon, All Fuels, Wind, Small-scale photovoltaic, Annual, 2022.
47 U.S. EIA, Interactive GIS Data Viewer, Oregon, Wind Power Plants, accessed February 18, 2023.
48 U.S. EIA, Electric Power Monthly (February 2023), Table 6.2.B.
49 U.S. EIA, Preliminary Monthly Electric Generator Inventory (based on Form EIA-860M as a supplement to Form EIA-860), Inventory of Operating Generators as of December 2022 and Inventory of Planned Generators as of December 2022.
50 Oregon Department of Energy, Nolin Hills Wind Power Project, accessed February 18, 2023.
51 U.S. EIA, Electricity, Form EIA-860 detailed data with previous form data (EIA-860A/860B), 2021 Form EIA-860 Data, Schedule 3, 'Generator Data' (Operable Units Only).
52 U.S. EIA, Electricity Data Browser, Net generation for all sectors, Oregon, All fuels, Conventional hydroelectric, Wind, Biomass, Geothermal, All solar, Small-scale photovoltaic, All utility-scale solar, Utility-scale photovoltaic, Utility-scale thermal, Annual, 2001-22.
53 U.S. EIA, Preliminary Monthly Electric Generator Inventory (based on Form EIA-860M as a supplement to Form EIA-860) Inventory of Operating Generators as of December 2022.
54 U.S. EIA, Preliminary Monthly Electric Generator Inventory (based on Form EIA-860M as a supplement to Form EIA-860), Inventory of Planned Generators as of December 2022.
55 U.S. EIA, Electricity Data Browser, Net generation for all sectors, Oregon, All fuels, Conventional hydroelectric, Wind, Biomass, Geothermal, All solar, Small-scale photovoltaic, All utility-scale solar, Utility-scale photovoltaic, Utility-scale thermal, Annual, 2001-22.
56 U.S. EIA, Electricity Data Browser, Net generation for all sectors, Oregon, Biomass, Wood and wood-derived fuels, Other biomass, Annual, 2001-22.
57 U.S. EIA, Preliminary Monthly Electric Generator Inventory (based on Form EIA-860M as a supplement to Form EIA-860), Inventory of Operating Generators as of December 2022.
58 Oregon Department of Forestry, About Oregon's Forests, accessed February 18, 2023.
59 U.S. EIA, Electricity Data Browser, List of plants for wood and wood-derived fuels, Oregon, all sectors, 2022.
60 Oregon Department of Energy, 2022 Biennial Energy Report (November 2022), Energy by the Numbers, p. 19.
61 U.S. Census Bureau, Oregon, Table B25040, House Heating Fuel, 2021 American Community Survey 1-Year Estimates.
62 U.S. EIA, Monthly Densified Biomass Fuel Report, Table 1, Densified biomass fuel manufacturing facilities in the United States by state, region, and capacity, November 2022.
63 U.S. EIA, Electricity Data Browser, Net generation for all sectors, Oregon, All Fuels, Geothermal, Annual, 2001-22.
64 Roberts, Billy J., Geothermal Resources of the United States, National Renewable Energy Laboratory (February 22, 2018).
65 U.S. EIA, Electric Power Monthly (February 2023), Table 1.16.B.
66 U.S. Geological Survey, Volcano Hazards Program, Cascades Volcano Observatory, Why Study Cascade Volcanoes?, accessed February 18, 2023.
67 U.S. Department of Energy, Energy Efficiency and Renewable Energy, Geothermal Technologies Program, Oregon, DOE/GO-102004-2036 (February 2005), p. 1.
68 U.S. EIA, Preliminary Monthly Electric Generator Inventory (based on Form EIA-860M as a supplement to Form EIA-860), Inventory of Operating Generators as of December 2022.
69 Roberts, Billy J., Geothermal Resource of the United States, National Renewable Energy Laboratory (February 22, 2018).
70 U.S. Department of Energy, Energy Efficiency and Renewable Energy, Geothermal Technologies Program, Oregon, DOE/GO-102004-2036 (February 2005), p. 1.
71 Klampe, Michelle, "OSU-led wave energy testing facility reaches key construction milestones," OSU Press Release (January 19, 2023).
72 Oregon Department of Energy, Renewable Portfolio Standard, accessed March 7, 2023.
73 Oregon Department of Environmental Quality, Oregon Clean Energy Targets, accessed March 7, 2023.
74 Oregon Department of Geology and Mineral Industries, Mineral Land Regulation & Reclamation, Program Overview, Oil & Gas Program, updated April 21, 2022.
75 U.S. EIA, Oregon Natural Gas Gross Withdrawals, 1979-2021.
76 U.S. EIA, Natural Gas Reserves Summary as of Dec. 31, Annual, 2016-21.
77 U.S. EIA, Natural Gas Gross Withdrawals and Production, Dry Production, Annual, 2016-21.
78 Oregon Department of Energy, Energy Facilities & Safety, Facilities, Mist Underground Natural Gas Storage Facility, accessed February 18, 2023.
79 U.S. EIA, Natural Gas, Underground Natural Gas Storage Capacity, Total Number of Existing Fields, 2021.
80 U.S. EIA, Natural Gas, Underground Natural Gas Storage Capacity, Total Storage Capacity, Annual, 2021.
81 Robinson, J., et al., "Natural gas in transition: Grid-balancing tactics in flux as battery costs fall," S&P Global (June 8, 2021).
82 U.S. EIA, International and Interstate Movements of Natural Gas by State, Oregon, 2021.
83 Williams Company, Northwest Pipeline, accessed January 22, 2022.
84 Rosbach, Molly, "Oregonians perceive greater risk than benefit from natural gas export in state, study finds," Phys.org (April 7, 2022).
85 U.S. EIA, State Energy Data System, Table C16, Natural Gas Consumption, Total and per Capita, Ranked by State, 2020.
86 U.S. EIA, Natural Gas Consumption by End-Use, Oregon, Annual, 2021.
87 U.S. Census Bureau, Oregon, Table B25040, House Heating Fuel, 2021 American Community Survey 1-Year Estimates.
88 U.S. EIA, Crude Oil Proved Reserves, Reserves Changes, and Production, Proved Reserves as of December 31, 2021.
89 U.S. EIA, Crude Oil Production, Annual Thousand Barrels, 2021.
90 U.S. EIA, Oregon Number of Operable Refineries as of January 1, 1982-2022.
91 Oregon Department of Energy, Road Trip: Where Oregon Gets Its Transportation Fuels (May 13, 2021).
92 Oregon Department of Energy, 2020 Biennial Energy Report (November 2020), Chapter: Energy 101, p. 35-36.
93 Schick, Tony, "Canadian crude oil is going by rail to Portland before shipping off to Asia," OPB: Oregon Public Broadcasting (March 16, 2018).
94 U.S. EIA, State Energy Data System, Table F16, Total Petroleum Consumption Estimates, 2020.
95 U.S. EIA, State Energy Data System, Table C8, Transportation Sector Energy Consumption Estimates, 2020.
96 U.S. EIA, State Energy Data System, Table F16, Total Petroleum Consumption Estimates, 2020.
97 U.S. Census Bureau, Oregon, Table B25040, House Heating Fuel, 2021 American Community Survey 1-Year Estimates.
98 Oregon Department of Energy, Renewable Fuels, Ethanol, accessed February 19, 2023.
99 U.S. EIA, U.S. fuel ethanol plant count by state, 2022.
100 U.S. EIA, Interactive GIS Data Viewer, Oregon, Ethanol Plants, accessed February 19, 2023.
101 U.S. EIA, State Energy Data System, Table F25, Fuel ethanol consumption estimates, 2021.
102 U.S. EIA, State Energy Data System, Table P1, Primary Energy Production Estimates in Physical Units, 2020.
103 Oregon Department of Energy, 2018 Biennial Energy Report (November 2018), Chapter 1, Energy by the Numbers, p.18.
104 U.S. Department of Energy, Energy Efficiency and Renewable Energy, Alternative Fuels Data Center, Biodiesel Laws and Incentives in Oregon, Renewable Fuels Mandate, accessed February 19, 2023.
105 Oregon Oils, About Our Company in Portland, Oregon, accessed February 19, 2023.
106 U.S. EIA, State Energy Data System, Table P1, Primary Energy Production Estimates in Physical Units, 2020.
107 U.S. EIA, State Energy Data System, Table F26, Biodiesel Consumption Estimates, 2020.
108 U.S. EIA, Annual Coal Report 2021 (October 2022), Table 15, Recoverable Coal Reserves at Producing Mines, Estimated Recoverable Reserves, and Demonstrated Reserve Base by Mining Method, 2021.
109 Duncan, Donald C., Geology and Coal Deposits in Part of the Coos Bay Coal Field, Oregon, U.S. Department of the Interior, Geological Survey Bulletin 982-B (Washington, 1953), p. 53.
110 Oregon Department of Geology and Mineral Industries, Mineral Land Regulation and Reclamation, Program Overview, Surface Mining Program, accessed February 17, 2023.
111 Oregon Department of Energy, 2022 Biennial Energy Report (November 2022), Energy by the Numbers, p. 4.
112 U.S. EIA, Annual Coal Distribution Report 2021 (October 2022), By Coal Destination State, Oregon Table DS-33, Domestic Coal Distribution, by Destination State, 2021.
Other Resources
Energy-Related Regions and Organizations
- Petroleum Administration for Defense District (PADD): 5
- North American Electric Reliability Corporation (NERC) ERO Enterprise: Regional Entities: Western Electricity Coordinating Council (WECC)
Other Websites
- Oregon Department of Energy
- Oregon Public Utility Commission
- Oregon Sustainable Transportation Initiative
- Energy Trust of Oregon
- EIA Oregon Flickr Album
- Oregon Housing and Community Services, Energy and Weatherization (WX)
- Oregon Department of Forestry, Biomass
- Go Electric Oregon
- State of Oregon Department of Geology and Minerals Industry, Mineral Land Regulation & Reclamation
- Northwest Power and Conservation Council, Power Supply
- Alternative Fuels Data Center, Federal and State Laws and Incentives
- U.S. Department of Health and Human Services, Administration for Children and Families, Office of Community Services, Low Income Home Energy Assistance Program (LIHEAP)
- Benefits.Gov, Housing and Public Utilities
- NC Clean Energy Technology Center, Database of State Incentives for Renewables and Efficiency (DSIRE)
- National Association of Regulatory Utility Commissioners (NARUC)
- National Association of State Energy Officials (NASEO)
- National Conference of State Legislatures (NCSL), Research and Policy
- National Renewable Energy Laboratory (NREL), Geospatial Data Science Data and Tools
- U.S. Geological Survey (USGS), Publications
- U.S. Department of the Interior, Bureau of Ocean Energy Management
- Western Interstate Energy Board
- Bonneville Power Administration
- West Coast Green Highway
- U.S. Geological Survey, Maps
- Lawrence Livermore National Laboratory, Energy Flow Charts
- National Renewable Energy Laboratory, State and Local Planning for Energy (SLOPE)
- EIA Natural Gas Storage Dashboard
- EIA Energy Disruptions
- U.S. Department of Agriculture (USDA), Rural Development, Energy Programs