Kentucky Quick Facts
- Kentucky is the fifth-largest coal-producing state in the nation. About one out of five U.S. operating coal mines are located in Kentucky, more than any other state except West Virginia and Pennsylvania.
- Natural gas-fired power plants generated 25% of Kentucky's in-state electricity in 2022, more than double the share from five years earlier.
- In 2022, about 68% of Kentucky's utility-scale electricity net generation was coal-fired, the third-largest share of any state after West Virginia and Wyoming.
- Kentucky has 22 underground natural gas storage sites that can hold almost 222 billion cubic feet of gas, which is about 2% of U.S. total underground storage capacity.
- In 2022, Kentucky had the 18th-lowest average electricity price of any state and the third-lowest price for a state east of the Mississippi River. Slightly more than half of Kentucky households use electricity for their heating.
Last Updated: September 21, 2023
Data
Last Update: April 18, 2024 | Next Update: May 16, 2024
| Prices | |||||
|---|---|---|---|---|---|
| Petroleum | Kentucky | U.S. Average | Period | find more | |
| Domestic Crude Oil First Purchase | $ 68.37 /barrel | $ 72.26 /barrel | Jan-24 | ||
| Natural Gas | Kentucky | U.S. Average | Period | find more | |
| City Gate | $ 3.96 /thousand cu ft | $ 4.76 /thousand cu ft | Jan-24 | find more | |
| Residential | $ 10.10 /thousand cu ft | $ 11.82 /thousand cu ft | Jan-24 | find more | |
| Coal | Kentucky | U.S. Average | Period | find more | |
| Average Sales Price | $ 78.22 /short ton | $ 54.46 /short ton | 2022 | ||
| Delivered to Electric Power Sector | $ 2.43 /million Btu | $ 2.48 /million Btu | Jan-24 | ||
| Electricity | Kentucky | U.S. Average | Period | find more | |
| Residential | 12.27 cents/kWh | 15.45 cents/kWh | Jan-24 | find more | |
| Commercial | 11.59 cents/kWh | 12.68 cents/kWh | Jan-24 | find more | |
| Industrial | 7.14 cents/kWh | 8.10 cents/kWh | Jan-24 | find more | |
| Reserves | |||||
|---|---|---|---|---|---|
| Reserves | Kentucky | Share of U.S. | Period | find more | |
| Crude Oil (as of Dec. 31) | 7 million barrels | * | 2021 | find more | |
| Expected Future Production of Dry Natural Gas (as of Dec. 31) | 1,256 billion cu ft | 0.2% | 2021 | find more | |
| Expected Future Production of Natural Gas Plant Liquids | 63 million barrels | 0.2% | 2021 | find more | |
| Recoverable Coal at Producing Mines | 349 million short tons | 3.1% | 2022 | find more | |
| Rotary Rigs & Wells | Kentucky | Share of U.S. | Period | find more | |
| Natural Gas Producing Wells | 12,711 wells | 2.6% | 2020 | find more | |
| Capacity | Kentucky | Share of U.S. | Period | ||
| Crude Oil Refinery Capacity (as of Jan. 1) | 291,000 barrels/calendar day | 1.6% | 2023 | ||
| Electric Power Industry Net Summer Capacity | 18,328 MW | 1.5% | Jan-24 | ||
| Supply & Distribution | |||||
|---|---|---|---|---|---|
| Production | Kentucky | Share of U.S. | Period | find more | |
| Total Energy | 814 trillion Btu | 0.8% | 2021 | find more | |
| Crude Oil | 4 thousand barrels per day | * | Jan-24 | find more | |
| Natural Gas - Marketed | 85,513 million cu ft | 0.2% | 2022 | find more | |
| Coal | 28,472 thousand short tons | 4.8% | 2022 | find more | |
| Total Utility-Scale Net Electricity Generation | Kentucky | Share of U.S. | Period | find more | |
| Total Net Electricity Generation | 6,816 thousand MWh | 1.8% | Jan-24 | ||
| Utility-Scale Net Electricity Generation (share of total) | Kentucky | U.S. Average | Period | ||
| Petroleum-Fired | 0.1 % | 0.4 % | Jan-24 | find more | |
| Natural Gas-Fired | 22.3 % | 42.2 % | Jan-24 | find more | |
| Coal-Fired | 70.1 % | 19.9 % | Jan-24 | find more | |
| Nuclear | 0.0 % | 18.2 % | Jan-24 | find more | |
| Renewables | 7.5 % | 18.8 % | Jan-24 | ||
| Stocks | Kentucky | Share of U.S. | Period | find more | |
| Motor Gasoline (Excludes Pipelines) | 100 thousand barrels | 0.8% | Jan-24 | ||
| Distillate Fuel Oil (Excludes Pipelines) | 749 thousand barrels | 0.8% | Jan-24 | find more | |
| Natural Gas in Underground Storage | 172,611 million cu ft | 2.4% | Jan-24 | find more | |
| Petroleum Stocks at Electric Power Producers | 245 thousand barrels | 1.1% | Jan-24 | find more | |
| Coal Stocks at Electric Power Producers | 5,956 thousand tons | 4.9% | Jan-24 | find more | |
| Fueling Stations | Kentucky | Share of U.S. | Period | ||
| Motor Gasoline | 2,003 stations | 1.8% | 2021 | ||
| Propane | 19 stations | 0.8% | Mar-24 | ||
| Electric Vehicle Charging Locations | 303 stations | 0.5% | Mar-24 | ||
| E85 | 73 stations | 1.7% | Mar-24 | ||
| Biodiesel, Compressed Natural Gas, and Other Alternative Fuels | 5 stations | 0.2% | Mar-24 | ||
| Consumption & Expenditures | |||||
|---|---|---|---|---|---|
| Summary | Kentucky | U.S. Rank | Period | ||
| Total Consumption | 1,689 trillion Btu | 21 | 2021 | find more | |
| Total Consumption per Capita | 375 million Btu | 14 | 2021 | find more | |
| Total Expenditures | $ 20,478 million | 24 | 2021 | find more | |
| Total Expenditures per Capita | $ 4,544 | 14 | 2021 | find more | |
| by End-Use Sector | Kentucky | Share of U.S. | Period | ||
| Consumption | |||||
| » Residential | 341 trillion Btu | 1.6% | 2021 | find more | |
| » Commercial | 244 trillion Btu | 1.4% | 2021 | find more | |
| » Industrial | 606 trillion Btu | 1.9% | 2021 | find more | |
| » Transportation | 498 trillion Btu | 1.8% | 2021 | find more | |
| Expenditures | |||||
| » Residential | $ 3,837 million | 1.4% | 2021 | find more | |
| » Commercial | $ 2,553 million | 1.3% | 2021 | find more | |
| » Industrial | $ 3,687 million | 1.6% | 2021 | find more | |
| » Transportation | $ 10,400 million | 1.7% | 2021 | find more | |
| by Source | Kentucky | Share of U.S. | Period | ||
| Consumption | |||||
| » Petroleum | 116 million barrels | 1.6% | 2021 | find more | |
| » Natural Gas | 384 billion cu ft | 1.2% | 2022 | find more | |
| » Coal | 23,391 thousand short tons | 4.5% | 2022 | find more | |
| Expenditures | |||||
| » Petroleum | $ 12,133 million | 1.6% | 2021 | find more | |
| » Natural Gas | $ 3,045 million | 1.1% | 2022 | find more | |
| » Coal | $ 1,301 million | 4.9% | 2022 | find more | |
| Consumption for Electricity Generation | Kentucky | Share of U.S. | Period | find more | |
| Petroleum | 14 thousand barrels | 0.5% | Jan-24 | find more | |
| Natural Gas | 12,326 million cu ft | 1.1% | Jan-24 | find more | |
| Coal | 2,272 thousand tons | 5.4% | Jan-24 | find more | |
| Energy Source Used for Home Heating (share of households) | Kentucky | U.S. Average | Period | ||
| Natural Gas | 35.3 % | 46.2 % | 2022 | ||
| Fuel Oil | 0.7 % | 3.9 % | 2022 | ||
| Electricity | 54.6 % | 41.3 % | 2022 | ||
| Propane | 6.6 % | 5.0 % | 2022 | ||
| Other/None | 2.9 % | 3.5 % | 2022 | ||
| Environment | |||||
|---|---|---|---|---|---|
| Renewable Energy Capacity | Kentucky | Share of U.S. | Period | find more | |
| Total Renewable Energy Electricity Net Summer Capacity | 1,290 MW | 0.4% | Jan-24 | ||
| Ethanol Plant Nameplate Capacity | 53 million gal/year | 0.3% | 2023 | ||
| Renewable Energy Production | Kentucky | Share of U.S. | Period | find more | |
| Utility-Scale Hydroelectric Net Electricity Generation | 466 thousand MWh | 2.2% | Jan-24 | ||
| Utility-Scale Solar, Wind, and Geothermal Net Electricity Generation | 5 thousand MWh | * | Jan-24 | ||
| Utility-Scale Biomass Net Electricity Generation | 40 thousand MWh | 1.0% | Jan-24 | ||
| Small-Scale Solar Photovoltaic Generation | 8 thousand MWh | 0.2% | Jan-24 | ||
| Fuel Ethanol Production | 939 thousand barrels | 0.3% | 2021 | ||
| Renewable Energy Consumption | Kentucky | U.S. Rank | Period | find more | |
| Renewable Energy Consumption as a Share of State Total | 6.1 % | 43 | 2021 | ||
| Fuel Ethanol Consumption | 5,174 thousand barrels | 25 | 2021 | ||
| Total Emissions | Kentucky | Share of U.S. | Period | find more | |
| Carbon Dioxide | 111.3 million metric tons | 2.3% | 2021 | ||
| Electric Power Industry Emissions | Kentucky | Share of U.S. | Period | find more | |
| Carbon Dioxide | 55,012 thousand metric tons | 3.3% | 2022 | ||
| Sulfur Dioxide | 44 thousand metric tons | 4.1% | 2022 | ||
| Nitrogen Oxide | 31 thousand metric tons | 2.5% | 2022 | ||
Analysis
Last Updated: September 21, 2023
Overview
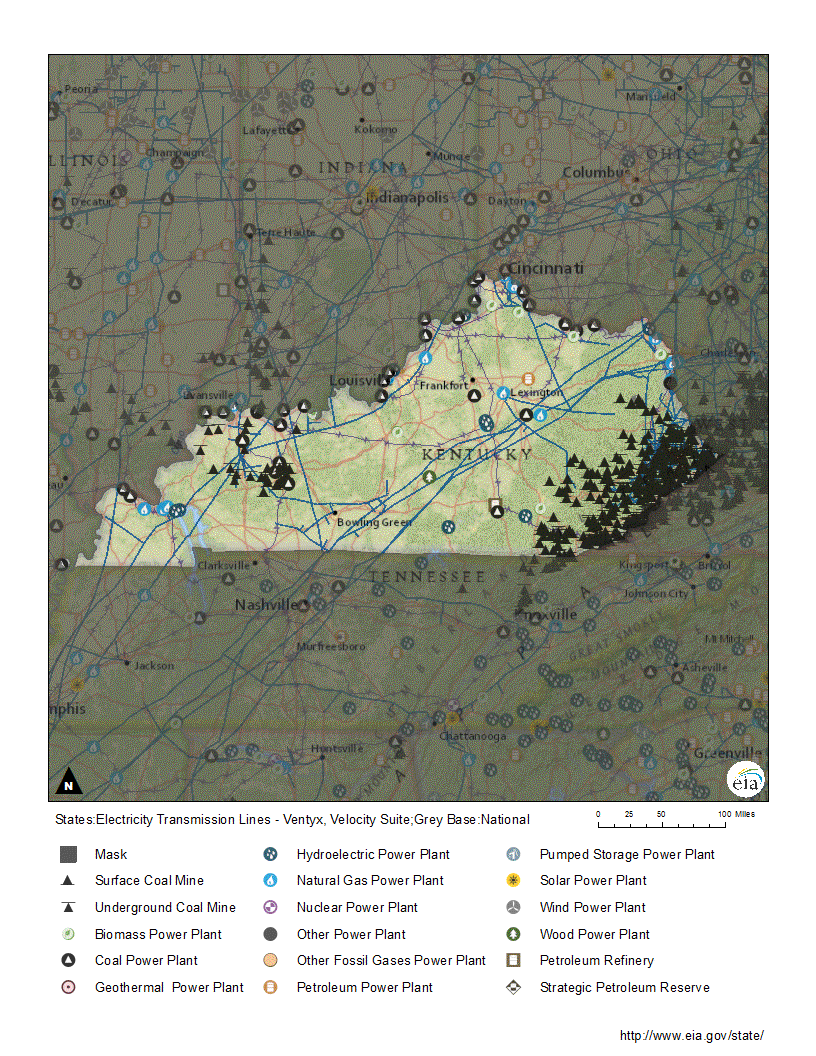
Kentucky, home to the nation's gold reserves at Fort Knox and the popular Kentucky Derby horse race at Churchill Downs in Louisville, became the first state west of the Appalachian Mountains in 1792.1 Bordered on the north by the Ohio River, Kentucky stretches from the Appalachian Mountains in the east to the flood plain of the Mississippi River in the west.2 In between, the rolling hills of the state's fertile Bluegrass region extend southward from the Ohio River to the Pennyroyal region, which is famous for its thousands of caverns and springs, including Mammoth Cave National Park.3,4 Major coal deposits are found both in the Central Appalachian Basin in the eastern part of the state and in the Illinois Basin in the northwest.5 Those basins also contain crude oil and natural gas reserves.6,7,8 Dams on the Tennessee, Cumberland, Ohio, and Laurel rivers provide Kentucky with hydroelectric power.9 Although two-thirds of Kentucky's agricultural economy is livestock, primarily thoroughbred horses and beef cattle, the state's ample rainfall, temperate climate, and fertile soils provide ideal conditions for growing several crops, including tobacco, soybeans, corn, and wheat.10,11,12 Corn and beverage waste from Kentucky distilleries provide feedstock for the state's fuel ethanol production.13,14
Kentucky has an energy-intensive economy, and ranks 12th among the states in the amount of energy used per dollar of GDP.15 The industrial sector is the state's largest energy consumer, accounting for about 36% of total end-use energy consumption.16 The manufacture of food, beverage, and tobacco products; motor vehicles; primary and fabricated metal products; and chemicals are major contributors to the state's GDP, as are agriculture and forestry. Coal mining and petroleum refining are two of Kentucky's energy-intensive industries.17 The transportation sector makes up about 30% of the state's energy consumption, followed by the residential sector at about 20%, and the commercial sector accounts for about 14% of state energy use.18
Coal
Kentucky is the fifth-largest coal producer among the states.
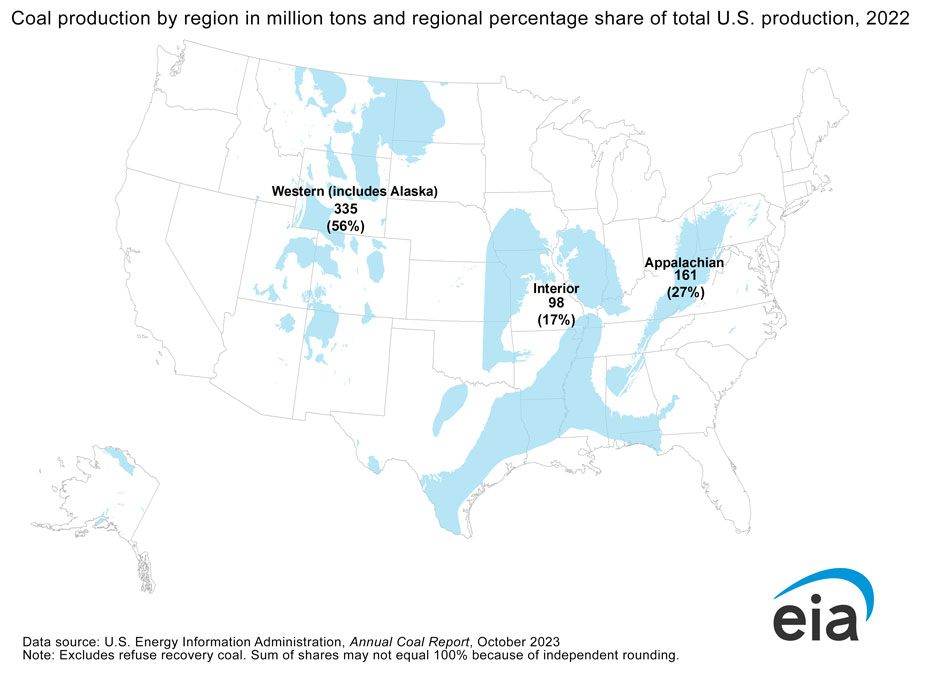
Kentucky ranks fifth in the nation in estimated recoverable coal reserves and fifth in coal production.19,20 Coal was mined in Kentucky as early as 1790. Since then, nearly 10 billion tons of coal have been mined in the state.21,22 About three-fifths of Kentucky's coal mines are surface mines, but underground mines account for about 80% of the state's coal production.23 The state's mines produce only bituminous coal, which is the most abundant type of coal found in the United States and is used for producing electricity, iron, and steel.24,25 For many years, Kentucky was the third-largest coal-producing state, after Wyoming and West Virginia, and typically accounted for about one-tenth of total U.S. coal production.26 However, Kentucky's coal production declined in response to demand as U.S. coal-fired electricity generating plants shut down and generation from renewables and natural gas increased.27,28,29,30 In 2020, Kentucky's coal production declined to its lowest level since 1915. Although the state's coal output increased in 2021 and 2022, it accounted for slightly less than 5% of total U.S. production.31,32,33,34 Still, about one out of five U.S. operating coal mines are located in Kentucky, and it has more mines than in any other state except for West Virginia and Pennsylvania.35
Kentucky plays an important role in the benchmark prices for eastern U.S. coal, which are determined in the Central Appalachian (CAPP) coal delivery zone located near where the Big Sandy River flows into the Ohio River. Kentucky meets Ohio and West Virginia at the rivers' confluence, and coal is delivered to the CAPP from mines in those three states, as well as from Virginia and Tennessee. The coal arrives by rail or truck for transport on multi-car trains and barges to customers—including coal-fired electricity generating plants, industrial plants, commercial and institutional facilities, and coking plants—throughout the country.36
About 85% of Kentucky's coal stays in the United States, with about two-fifths of that coal remaining in Kentucky. The rest of the coal is sent to nearly 20 other states, where it is burned primarily by power plants to generate electricity.37,38 Kentucky ranks among the top 10 states in coal consumption, and nearly all that coal is used for electricity generation. In 2021, about 37% of Kentucky's coal needs were met with the state's own coal, and the remaining coal consumed in Kentucky was brought in from other states, primarily Wyoming, Illinois, and West Virginia.39,40,41
Electricity
In 2022, coal generated 68% of Kentucky’s in-state electricity, a larger share than all but two other states.
In 2022, coal-fired power plants supplied 68% of Kentucky's electricity generation, the third-largest share among the states after West Virginia and Wyoming.42,43 Historically, coal-fired power plants produced more than 90% of Kentucky's net generation. However, as older coal-fired generating units became more costly to operate, about 5,600 megawatts of coal-fired generating capacity shut down over the past decade.44,45,46,47 Kentucky remains among the top 10 states in the nation in coal-fired generating capacity with about 9,400 megawatts at the beginning of 2023.48
Natural gas provides an increasing amount of Kentucky's net generation. In 2022, natural gas-fired power plants generated 25% of the state's electricity, more than double the share from five years earlier. The rest of Kentucky's electricity generation, less than one-tenth, came mostly from hydroelectric power plants, along with small contributions from biomass, solar energy, and petroleum-fired generation.49
In 2022, Kentucky had the 18th-lowest average electricity price of any state and the third-lowest price east of the Mississippi River.50 Slightly more than half of Kentucky households use electricity as their primary heating source.51
Petroleum
Kentucky accounts for less than 0.1% of U.S. proved crude oil reserves and production.52,53 Half the state's counties have producing oil wells, and the highest producing areas are located in eastern and western Kentucky.54,55 Kentucky's oil production of nearly 2.3 million barrels in 2022 was less than one-third of the state's record oil production of 7.9 million barrels in 1983. The state's annual oil production has been less than 3 million barrels every year, except for one, during the past three decades.56
Kentucky has one oil refinery that can process up to 291,000 barrels of crude oil per calendar day.
Kentucky has one operating crude oil refinery, located in the city of Catlettsburg in northeastern Kentucky. It is the 15th largest U.S. refinery and can process 291,000 barrels of crude oil per calendar day to make motor gasoline, distillates, asphalt, heavy fuel oil, and propane. The Catlettsburg refinery accounts for about 1.6% of U.S. refining capacity.57,58 A smaller refinery located in the city of Somerset in southeastern Kentucky, which could process about 5,500 barrels of crude oil per calendar day, closed in 2020 for economic reasons. The refinery's owner is converting the facility to process soybeans to produce biodiesel.59,60,61 Additional refined petroleum products arrive in the state via interstate pipelines and by river barges at Kentucky ports along the Ohio River.62,63,64
The transportation sector accounts for three out of every four barrels of petroleum consumed in Kentucky, and motor gasoline accounts for about two-fifths the state's total petroleum use.65,66 Conventional motor gasoline can be sold statewide, except for in all or part of three counties around Louisville that allow only reformulated gasoline blended with ethanol to reduce air pollution. In July 2018, with the approval of the federal government, the state withdrew three of its counties that make up the southern suburbs of Cincinnati from the federal reformulated gasoline program.67,68,69 The industrial sector accounts for about one-fifth of the petroleum consumed in Kentucky. The rest of the small amount of petroleum used in the state is split almost equally between the commercial sector and the residential sector, where about 7 out of 100 Kentucky households heat with propane, fuel oil, or kerosene.70,71
Natural gas
Kentucky holds about 0.2% of U.S. proved natural gas reserves, but organic-rich shales that underlie eastern Kentucky may hold substantial additional natural gas resources.72,73,74 The state accounts for about 0.2% of the nation's marketed natural gas production.75 Most of the state's natural gas is produced from wells located in eastern Kentucky.76,77 The state's annual natural gas production increased in the early 2000s, peaking in 2010 at about 135 billion cubic feet, but has declined about two-thirds since then. However, in 2021, the state's natural gas output increased for the first time since 2005, rising to 75 billion cubic feet as natural gas prices and demand rose.78,79,80,81
Kentucky’s 22 underground storage facilities can hold almost 222 billion cubic feet of natural gas.
Consumption of natural gas in Kentucky is almost five times greater than the state's production, and several interstate natural gas pipelines bring natural gas supplies to Kentucky consumers.82,83,84 For more than two decades, most of the natural gas that entered Kentucky arrived by pipeline from the U.S. Gulf Coast. However, starting in 2015, Kentucky began to receive more natural gas produced in the Utica and Marcellus shale formations in Pennsylvania, Ohio, and West Virginia. In 2021, about three-fourths of the natural gas transported by pipeline to Kentucky came from Ohio and West Virginia. About 90% of the natural gas that entered Kentucky was sent on to other states, primarily Tennessee and Indiana.85 Some natural gas stays in Kentucky in underground storage. The state has 22 underground natural gas storage facilities that can hold nearly 222 billion cubic feet of gas—about 2% of U.S. total storage capacity.86,87
In 2022, Kentucky's electric power sector consumed record volumes of natural gas and accounted for 39% of the natural gas used in the state. Natural gas consumption by the sector more than doubled the level from six years earlier. The industrial sector also consumed record natural gas, making up 37% of natural gas use. The residential sector, where about one-third of Kentucky households use natural gas for home heating, received about 14% of the natural gas delivered to end users in the state. The commercial sector accounted for about 11% of state natural gas consumption. A minor amount of natural gas is used in the transportation sector.88,89 Kentucky's per capita natural gas use is less than in two-fifths of the states.90
Renewable energy
Renewable resources are a relatively small part of Kentucky's energy mix. Hydropower accounts for nearly all of the state's renewable electricity generation. In 2022, 11 hydroelectric dams produced about 6% of the state's total electricity net generation.91,92 Almost one-tenth of the renewable generation in Kentucky, or about 0.6% of the state's total generation, came from biomass.93 Most of the biomass-fueled electricity generating facilities in Kentucky use landfill gas. However, the largest biomass facility—with 49 megawatts of capacity and accounting for two-thirds of the state's total biomass generation capacity—uses wood waste.94 The state's biomass resources include its forests, which provide feedstock for two wood pellet manufacturing plants that have a combined production capacity of 80,000 tons a year.95 About 2% of Kentucky households heat with wood.96
Kentucky has both utility-scale (1 megawatt or larger) and small-scale (less than 1 megawatt), customer-sited solar power generation facilities, which together accounted for 0.2% of the state's total electricity generation in 2022.97 The state's largest utility-scale solar photovoltaic (PV) generating facility is a 50-megawatt solar farm that came online in late 2022 south of Lexington. A 55-megawatt solar farm is scheduled to come online in the second half of 2023.98 Kentucky has few wind resources suitable for utility-scale power projects, and there are no commercial wind power facilities in the state.99,100
Kentucky has two fuel ethanol production plants with a combined capacity of about 53 million gallons per year.101 A plant owned by a farmers' cooperative produces most of the ethanol, using corn as its primary feedstock.102 The smaller ethanol plant is a recycling operation in a former bourbon distillery in Louisville that produces ethanol from waste non-alcoholic and alcoholic beverages; sugars; industrial alcohols; health and beauty alcohols (mouthwash and perfumes); and pharmaceutical manufacturing by-products.103 The state's annual ethanol consumption of 217 million gallons is more than four times greater than the 48 million gallons produced. Kentucky has one biodiesel production plant, which makes about 39 million gallons per year, 50% more the state's annual biodiesel consumption of about 26 million barrels.104,105,106
Kentucky does not have a renewable portfolio standard to require a certain amount of the state's electricity to be generated by renewable sources. However, state law provides for net metering of small-scale renewable generation from solar, wind, hydro, biomass, and biogas facilities of 45 kilowatts or less. Each investor-owned utility and rural electric cooperative's obligation to connect eligible small-scale generators is limited to 1% of the power provider's peak single-hour electricity load during the previous year.107 Kentucky also provides financial incentives to companies that invest at least $1 million in a renewable energy facility that generates at least 50 kilowatts of electricity from solar energy or at 1 least megawatt of electricity from wind energy, biomass, landfill gas, hydropower, or similar renewable resources.108
Endnotes
1 U.S. News & World Report, Kentucky, accessed August 1, 2023.
2 World Atlas, Kentucky, Kentucky Geography, accessed August 1, 2023.
3 Kentucky Geological Survey, Physiographic Map of Kentucky and The Mississippian Plateau or Pennyroyal Region, accessed August 1, 2023.
4 Kentucky Geological Survey, The Bluegrass Region, accessed August 1, 2023.
5 U.S. Geological Survey, USGS Coalfields of the Conterminous United States, accessed August 1, 2023.
6 U.S. Energy Information Administration (EIA), U.S. Energy Atlas, All Energy Infrastructure and Resources, Kentucky, accessed August 1, 2023.
7 U.S. EIA, Natural Gas Reserves Summary as of Dec. 31, Wet NG, Kentucky, 2016-21.
8 U.S. EIA, Crude Oil Proved Reserves, Reserves Changes, and Production, Proved Reserves as of 12/31, Kentucky, 2016-21.
9 U.S. EIA, U.S. Energy Atlas, All Energy Infrastructure and Resources, Kentucky, accessed August 1, 2023.
10 Kentucky Geological Survey, The Bluegrass Region, accessed August 1, 2023.
11 National Oceanic and Atmospheric Administration, Kentucky, accessed August 1, 2023.
12 NETSTATE, Kentucky, Kentucky Economy, updated December 19, 2017.
13 Kentucky Clean Fuels Coalition, Who is Producing Ethanol in Kentucky, accessed August 1, 2023.
14 Parallel Products, Beverage Destruction and Recycling, accessed August 1, 2023.
15 U.S. EIA, State Energy Data System, Table C10, Total Energy Consumption Estimates, Real Gross Domestic Product (GDP), Energy Consumption Estimates per Real Dollar of GDP, Ranked by State, 2021.
16 U.S. EIA, State Energy Data System, Table C1, Energy Consumption Overview: Estimates by Energy Source and End-Use Sector, 2021.
17 U.S. Bureau of Economic Analysis, Interactive Data, Regional Data, GDP & Personal Income, Annual Gross Domestic Product (GDP) by State, GDP in Current Dollars, NAICS, Kentucky, All statistics in table, 2021.
18 U.S. EIA, State Energy Data System, Table C1, Energy Consumption Overview: Estimates by Energy Source and End-Use Sector, 2021.
19 U.S. EIA, Annual Coal Report 2021 (October 18, 2022), Table 15, Recoverable Coal Reserves at Producing Mines, Estimated Recoverable Reserves, and Demonstrated Reserve Base by Mining Method, 2021.
20 U.S. EIA, Quarterly Coal Report October-December 2022 (April 2023), Table 2, Coal production by state, Year to date, 2022.
21 Kentucky Geological Survey, Kentucky Coal Production, Search the Kentucky Geological Survey's coal production database, accessed August 1, 2023.
22 U.S. EIA, Coal Data Browser, Aggregate coal mine production for all coal (short tons), Total, Annual, Kentucky, 2001-21.
23 U.S. EIA, Annual Coal Report 2021 (October 18, 2022), Table 1, Coal Production and Number of Mines by State and Mine Type, 2021 and 2020.
24 U.S. EIA, Annual Coal Report 2021 (October 18, 2022), Table 6, Coal Production and Number of Mines by State and Coal Rank, 2021.
25 U.S. EIA, Coal Explained, Types of coal, Bituminous, updated October 19, 2022.
26 U.S. EIA, Coal Data Browser, Aggregate coal mine production for all coal (short tons), Total, Annual, U.S., Wyoming, West Virginia, Pennsylvania, Illinois, Kentucky, Middle Atlantic, East North Central, East South Central, and South Atlantic, 2001-21.
27 U.S. EIA, "Renewable generation surpassed coal and nuclear in the U.S. electric power sector in 2022," Today in Energy (March 27, 2023).
28 U.S. EIA, "Coal will account for 85% of U.S. electric generating capacity retirements in 2022," Today in Energy (January 11, 2022).
29 U.S. EIA, "More than 100 coal-fired plants have been replaced or converted to natural gas since 2011," Today in Energy (August 5, 2020).
30 U.S. EIA, Preliminary Monthly Electric Generator Inventory (based on Form EIA-860M as a supplement to Form EIA-860), Inventory of Retired Generators as of July 2023, Plant State: United States, Technology: Conventional Steam Coal.
31 U.S. EIA, Annual Coal Report 2021 (October 18, 2022), Table 6, Coal Production and Number of Mines by State and Coal Rank, 2021.
32 U.S. EIA, State Energy Data Systems, State Energy Production Estimates 1960 Through 2021, Table PT1, Primary Energy Production Estimates in Physical Units, Kentucky, 1960-2021.
33 U.S. EIA, Quarterly Coal Report October-December 2022 (April 2023), Table 2, Coal production by state, Year to date, 2022.
34 Kentucky Geological Survey, Search the Coal Production Database, All Kentucky, Sum results by year, 1790-2017.
35 U.S. EIA, Annual Coal Report 2021 (October 18, 2022), Table 1, Coal Production and Number of Mines by State and Mine Type, 2021 and 2020.
36 U.S. EIA, "Trading Point: Central Appalachian (CAPP) Is the Nation's Benchmark Price for Eastern Coal," Today in Energy (September 19, 2012).
37 U.S. EIA, Annual Coal Distribution Report 2021 (October 18, 2022), Domestic distribution of U.S. coal by origin State, consumer, destination and method of transportation, Kentucky, Table OS-7, Domestic Coal Distribution, by Origin State, 2021.
38 U.S. EIA, Annual Coal Distribution Report 2021 (October 18, 2022), Domestic and Foreign Distribution of U.S. Coal by State of Origin, 2021.
39 U.S. EIA, State Energy Data System, Table F23, Coal Consumption Estimates and Imports and Exports of Coal Coke, 2021.
40 U.S. EIA, Annual Coal Report 2021 (October 18, 2022), Table 26, Coal Consumption by End Use Sector, Census Division, and State, 2021 and 2020.
41 U.S. EIA, Annual Coal Distribution Report 2021 (October 18, 2022), Domestic distribution of U.S. coal by destination State, consumer, destination and method of transportation, Kentucky, Table DS-15, Domestic Coal Distribution, by Destination State, 2021.
42 U.S. EIA, Electricity Data Browser, Net generation for all sectors (thousand megawatthours), Kentucky, Annual, 2001-22.
43 U.S. EIA, Electric Power Monthly (February 2023), Tables 1.3.B and 1.4.B.
44 U.S. EIA, Preliminary Monthly Electric Generator Inventory (based on Form EIA-860M as a supplement to Form EIA-860), Inventory of Retired Generators as of July 2023, Plant State: Kentucky, Technology: Conventional Steam Coal.
45 U.S. EIA, "68% of U.S. coal fleet retirements since 2011 were plants fueled by bituminous coal," Today in Energy (August 27, 2021).
46 U.S. EIA, "Coal will account for 85% of U.S. electric generating capacity retirements in 2022," Today in Energy (January 11, 2022).
47 "TVA's Paradise Fossil Power Plant closes after 50 years," WFIE (February 2, 2020).
48 U.S. EIA, Electric Power Monthly (February 2023), Table 6.2.C.
49 U.S. EIA, Electricity Data Browser, Net generation for all sectors (thousand megawatthours), Kentucky, Annual, 2001-22.
50 U.S. EIA, Electric Power Monthly (February 2023), Table 5.6.B.
51 U.S. Census Bureau, House Heating Fuel, Table B25040, 2021 ACS 1-Year Estimates Detailed Tables, Kentucky.
52 U.S. EIA, Crude Oil Production, Annual-Thousand Barrels, 2017-22.
53 U.S. EIA, Crude Oil Proved Reserves, Reserves Changes, and Production, Proved Reserves as of 12/31, Annual, 2016-21.
54 Kentucky Geological Survey, Oil and Natural Gas in Kentucky (June 2019), Leading Producing Zones, p. 1.
55 U.S. EIA, U.S. Energy Atlas, All Energy Infrastructure and Resources, Kentucky, accessed August 3, 2023.
56 U.S. EIA, Kentucky Field Production of Crude Oil, Annual, Thousand Barrels, 1981-2022.
57 U.S. EIA, Refinery Capacity Report 2023 (June 21, 2023), Table 1, Number and Capacity of Operable Petroleum Refineries by PAD District and State as of January 1, 2023 and Table 3, Capacity of Operable Petroleum Refineries by State as of January 1, 2023.
58 Marathon Petroleum, Catlettsburg Refinery, accessed August 3, 2023.
59 Mardis, Bill, "Continental Refinery will not resume production," Commonwealth Journal (July 8, 2020).
60 Continental Refining Company, "Continental Refining breaks ground on soybean biodiesel refinery in Somerset," Press Release (December 21, 2021).
61 Continental Refining Company, "Continental Refining updates its progress in $31.5M transformation to BioFuels," Press Release (September 20, 2022).
62 World Port Source, Jefferson Riverport, Port Commerce, accessed August 3, 2023.
63 U.S. Department of Energy, State of Kentucky Energy Sector Risk Profile, p. 4, accessed August 3, 2023.
64 U.S. EIA, U.S. Energy Atlas, All Energy Infrastructure and Resources, Kentucky, accessed August 3, 2023.
65 U.S. EIA, State Energy Data System, Table F16, Total Petroleum Consumption Estimates, 2021.
66 U.S. EIA, State Energy Data System, Table C2, Energy Consumption Estimates for Major Energy Sources in Physical Units, 2021.
67 U.S. Environmental Protection Agency, Gasoline Standards, Reformulated Gasoline, "Opt-In" Areas, accessed August 3, 2023.
68 Larson, B.K., U.S. Gasoline Requirements, Map, ExxonMobil (January 2018).
69 U.S. Environmental Protection Agency, Removal of the RFG Program from the Northern Kentucky Area of the Cincinnati-Hamilton Ozone Maintenance Area, accessed August 3, 2023.
70 U.S. EIA, State Energy Data System, Table F16, Total Petroleum Consumption Estimates, 2021.
71 U.S. Census Bureau, House Heating Fuel, Table B25040, 2021 ACS 1-Year Estimates Detailed Tables, Kentucky.
72 U.S. EIA, Natural Gas Reserves Summary as of Dec. 31, Wet Natural Gas, Annual, 2016-21.
73 Mardon, Sarah, "KGS to Study Deep Unconventional Oil and Gas Potential with U.S. Department of Energy Grant," University of Kentucky News (December 19, 2019).
74 "Kentucky Launches New Study of Rogersville Shale Potential," Marcellus Drilling News (January 2, 2020).
75 U.S. EIA, Natural Gas Gross Withdrawals and Production, Marketed Production, Annual-Million Cubic Feet, 2017-22.
76 Kentucky Geological Survey, Oil and Natural Gas in Kentucky (June 2019), Leading Producing Zones, p. 1.
77 U.S. EIA, U.S. Energy Atlas, All Energy Infrastructure and Resources, Kentucky, accessed August 4, 2023.
78 U.S. EIA, Kentucky Natural Gas Marketed Production, Annual, 1967-2021.
79 U.S. EIA, Natural Gas Spot and Futures Prices (NYMEX), Futures Prices, monthly, 2016-21.
80 U.S. EIA, October," Today in Energy (March 2, 2021).
81 U.S. EIA, "U.S. natural gas production set a new record in 2021," Today in Energy (October 12, 2022).
82 U.S. EIA, Natural Gas Gross Withdrawals and Production, Marketed Production, Annual-Million Cubic Feet, 2017-22.
83 U.S. EIA, Natural Gas Consumption by End Use, Kentucky, Annual, 2017-22.
84 U.S. Department of Energy, State of Kentucky Energy Sector Risk Profile, p. 6, accessed August 4, 2023.
85 U.S. EIA, International & Interstate Movements of Natural Gas by State, Kentucky, Annual, 1989-2021.
86 U.S. EIA, Underground Natural Gas Storage Capacity, Total Number of Existing Fields, Annual, 2016-21.
87 U.S. EIA, Underground Natural Gas Storage Capacity, Total Storage Capacity, Annual, 2016-21.
88 U.S. EIA, Natural Gas Consumption by End Use, Kentucky, Annual, 2017-22.
89 U.S. Census Bureau, House Heating Fuel, Table B25040, 2021 ACS 1-Year Estimates Detailed Tables, Kentucky.
90 U.S. EIA, State Energy Data System, Table C16, Natural Gas Consumption, Total and per Capita, Ranked by State, 2021.
91 U.S. EIA, Electricity Data Browser, Net generation for all sectors (thousand megawatthours), Kentucky, Annual, 2001-22.
92 U.S. EIA, Electricity, Form EIA-860 detailed data, 2022 Form EIA-860 Data - Schedule 3, 'Generator Data' (Operable Units Only), Plant State: Kentucky, Technology: Conventional Hydroelectric.
93 U.S. EIA, Electricity Data Browser, Net generation for all sectors (thousand megawatthours), Kentucky, Annual, 2001-21.
94 U.S. EIA, Preliminary Monthly Electric Generator Inventory (based on Form EIA-860M as a supplement to Form EIA-860), Inventory of Retired Generators as of July 2023, Plant State: Kentucky, Technology: Wood/Wood Waste Biomass, Landfill Gas.
95 U.S. EIA, Monthly Densified Biomass Fuel Report, (September 1, 2023), Table 1, Densified biomass fuel manufacturing facilities in the United States by state, region, and capacity, June 2023.
96 U.S. Census Bureau, House Heating Fuel, Table B25040, 2021 ACS 1-Year Estimates Detailed Tables, Kentucky.
97 U.S. EIA, Electricity Data Browser, Net generation for all sectors (thousand megawatthours), Kentucky, Annual, 2001-22.
98 U.S. EIA, Preliminary Monthly Electric Generator Inventory (based on Form EIA-860M as a supplement to Form EIA-860), Inventory of Operating Generators as of July 2023, Plant State: Kentucky, Technology: Solar Photovoltaic and Inventory of Planned Generators as of June 2023, Plant State: Kentucky, Technology: Solar Photovoltaic.
99 U.S. Department of Energy, Energy Efficiency and Renewable Energy, WINDExchange, Wind Energy in Kentucky, Maps & Data, accessed August 10, 2023.
100 U.S. EIA, Preliminary Monthly Electric Generator Inventory (based on Form EIA-860M as a supplement to Form EIA-860), Inventory of Operating Generators as of July 2023, Plant State: Kentucky, Technology: Select All.
101 U.S. EIA, U.S. Fuel Ethanol Plant Production Capacity (August 7, 2023), Detailed nameplate capacity of fuel ethanol plants by Petroleum Administration for Defense District (PAD District) are available in XLS.
102 Commonwealth Agri-Energy, About Us, accessed August 10, 2023.
103 Parallel Products, Louisville, KY, accessed August 7, 2023.
104 U.S. EIA, State Energy Data System, Table F25, Fuel ethanol consumption estimates, 2021.
105 U.S. EIA, State Energy Data System, Table P4B, Primary Energy Production Estimates, Biofuels, in Thousand Barrels, Ranked by State 2021.
106 U.S. EIA, State Energy Data System, Table F26, Biodiesel Consumption Estimates, 2021.
107 NC Clean Energy Technology Center, DSIRE, Kentucky Net Metering, updated June 18, 2021.
108 NC Clean Energy Technology Center, DSIRE, Incentives for Energy Independence, updated July 16, 2021.
Other Resources
Energy-Related Regions and Organizations
- Coal Region: Appalachian
- Petroleum Administration for Defense District (PADD): 2
- Regional Transmission Organization (RTO) and Independent System Operator (ISO): Midcontinent Independent System Operator (MISO), PJM Interconnection (PJM)
- North American Electric Reliability Corporation (NERC) ERO Enterprise: Regional Entities: Reliability First Corporation (RFC), SERC Reliability Corporation (SERC)
Other Websites
- Kentucky Energy and Environment Cabinet, Office of Energy Policy
- Kentucky Public Service Commission
- Kentucky Department for Environmental Protection
- Kentucky Energy and Environment Cabinet, Natural Resources
- Kentucky Energy and Environment Cabinet, Oil & Gas
- Kentucky Geological Survey, Energy
- Kentucky Energy and Environment Cabinet
- Community Action Kentucky
- Tennessee Valley Authority in Kentucky
- Kentucky Energy and Environment Cabinet, Mining
- Kentucky Energy and Environment Cabinet, Abandoned Mine Lands
- Kentucky Department for Community Based Services, Low Income Home Energy Assistance Program (LIHEAP)
- Kentucky Housing Corporation, Weatherization Assistance Program
- Appalachian Regional Commission, ARC's Power Initiative
- EIA Kentucky Flickr Album
- Southern States Energy Board
- Southeastern Power Administration
- Alternative Fuels Data Center, Federal and State Laws and Incentives
- Benefits.Gov, Housing and Public Utilities
- NC Clean Energy Technology Center, Database of State Incentives for Renewables and Efficiency (DSIRE)
- National Association of Regulatory Utility Commissioners (NARUC)
- National Association of State Energy Officials (NASEO)
- National Conference of State Legislatures (NCSL), Research and Policy
- National Renewable Energy Laboratory (NREL), Geospatial Data Science Data and Tools
- U.S. Geological Survey (USGS), Publications
- Interstate Oil and Gas Compact Commission
- Tennessee Valley Authority
- U.S. Department of Health and Human Services, Administration for Children and Families, Office of Community Services, Low Income Home Energy Assistance Program (LIHEAP)
- U.S. Geological Survey, Maps
- Lawrence Livermore National Laboratory, Energy Flow Charts
- National Renewable Energy Laboratory, State and Local Planning for Energy (SLOPE)
- EIA Natural Gas Storage Dashboard
- EIA Energy Disruptions
- U.S. Department of Agriculture (USDA), Rural Development, Energy Programs