Alabama Quick Facts
- Alabama ranks sixth among the states in the production of electricity, and the state's total electricity consumption per capita is the fourth-highest in the nation.
- Alabama is the fifth-largest producer of electricity from nuclear power in the nation. The state's Browns Ferry nuclear power plant, with three reactors, is the second-largest U.S. nuclear electric generating facility after Arizona’s Palo Verde nuclear power plant.
- In 2022, Mobile was the largest port of entry for U.S. coal imports by volume and the fourth-largest port for coal exports. Almost 90% of the coal mined in Alabama is exported.
- Alabama is the sixth-largest hydroelectric power producer among the states. Twenty-three hydroelectric dams provided almost 7% of the state's electricity net generation in 2022.
- Alabama's three wood pellet plants have a combined production capacity of 683,000 tons a year. The state has the seventh-largest wood pellet production capacity, accounting for 5% of the U.S. total.
Last Updated: October 19, 2023
Data
Last Update: April 18, 2024 | Next Update: May 16, 2024
| Prices | |||||
|---|---|---|---|---|---|
| Petroleum | Alabama | U.S. Average | Period | find more | |
| Domestic Crude Oil First Purchase | $ 70.10 /barrel | $ 72.26 /barrel | Jan-24 | ||
| Natural Gas | Alabama | U.S. Average | Period | find more | |
| City Gate | $ 3.96 /thousand cu ft | $ 4.76 /thousand cu ft | Jan-24 | find more | |
| Residential | $ 16.69 /thousand cu ft | $ 11.82 /thousand cu ft | Jan-24 | find more | |
| Coal | Alabama | U.S. Average | Period | find more | |
| Average Sales Price | $ 269.00 /short ton | $ 54.46 /short ton | 2022 | ||
| Delivered to Electric Power Sector | $ 2.93 /million Btu | $ 2.48 /million Btu | Jan-24 | ||
| Electricity | Alabama | U.S. Average | Period | find more | |
| Residential | 14.40 cents/kWh | 15.45 cents/kWh | Jan-24 | find more | |
| Commercial | 13.66 cents/kWh | 12.68 cents/kWh | Jan-24 | find more | |
| Industrial | 7.14 cents/kWh | 8.10 cents/kWh | Jan-24 | find more | |
| Reserves | |||||
|---|---|---|---|---|---|
| Reserves | Alabama | Share of U.S. | Period | find more | |
| Crude Oil (as of Dec. 31) | 26 million barrels | 0.1% | 2021 | find more | |
| Expected Future Production of Dry Natural Gas (as of Dec. 31) | 1,295 billion cu ft | 0.2% | 2021 | find more | |
| Expected Future Production of Natural Gas Plant Liquids | 30 million barrels | 0.1% | 2021 | find more | |
| Recoverable Coal at Producing Mines | 181 million short tons | 1.6% | 2022 | find more | |
| Rotary Rigs & Wells | Alabama | Share of U.S. | Period | find more | |
| Natural Gas Producing Wells | 5,387 wells | 1.1% | 2020 | find more | |
| Capacity | Alabama | Share of U.S. | Period | ||
| Crude Oil Refinery Capacity (as of Jan. 1) | 142,100 barrels/calendar day | 0.8% | 2023 | ||
| Electric Power Industry Net Summer Capacity | 31,097 MW | 2.6% | Jan-24 | ||
| Supply & Distribution | |||||
|---|---|---|---|---|---|
| Production | Alabama | Share of U.S. | Period | find more | |
| Total Energy | 1,139 trillion Btu | 1.2% | 2021 | find more | |
| Crude Oil | 9 thousand barrels per day | 0.1% | Jan-24 | find more | |
| Natural Gas - Marketed | 95,790 million cu ft | 0.2% | 2022 | find more | |
| Coal | 10,408 thousand short tons | 1.8% | 2022 | find more | |
| Total Utility-Scale Net Electricity Generation | Alabama | Share of U.S. | Period | find more | |
| Total Net Electricity Generation | 12,879 thousand MWh | 3.4% | Jan-24 | ||
| Utility-Scale Net Electricity Generation (share of total) | Alabama | U.S. Average | Period | ||
| Petroleum-Fired | * | 0.4 % | Jan-24 | find more | |
| Natural Gas-Fired | 43.4 % | 42.2 % | Jan-24 | find more | |
| Coal-Fired | 14.0 % | 19.9 % | Jan-24 | find more | |
| Nuclear | 30.6 % | 18.2 % | Jan-24 | find more | |
| Renewables | 12.0 % | 18.8 % | Jan-24 | ||
| Stocks | Alabama | Share of U.S. | Period | find more | |
| Motor Gasoline (Excludes Pipelines) | 106 thousand barrels | 0.9% | Jan-24 | ||
| Distillate Fuel Oil (Excludes Pipelines) | 1,201 thousand barrels | 1.2% | Jan-24 | find more | |
| Natural Gas in Underground Storage | 25,607 million cu ft | 0.4% | Jan-24 | find more | |
| Petroleum Stocks at Electric Power Producers | 256 thousand barrels | 1.2% | Jan-24 | find more | |
| Coal Stocks at Electric Power Producers | 4,029 thousand tons | 3.3% | Jan-24 | find more | |
| Fueling Stations | Alabama | Share of U.S. | Period | ||
| Motor Gasoline | 3,110 stations | 2.8% | 2021 | ||
| Propane | 52 stations | 2.1% | Mar-24 | ||
| Electric Vehicle Charging Locations | 363 stations | 0.6% | Mar-24 | ||
| E85 | 23 stations | 0.5% | Mar-24 | ||
| Biodiesel, Compressed Natural Gas, and Other Alternative Fuels | 7 stations | 0.2% | Mar-24 | ||
| Consumption & Expenditures | |||||
|---|---|---|---|---|---|
| Summary | Alabama | U.S. Rank | Period | ||
| Total Consumption | 1,966 trillion Btu | 16 | 2021 | find more | |
| Total Consumption per Capita | 389 million Btu | 13 | 2021 | find more | |
| Total Expenditures | $ 24,224 million | 19 | 2021 | find more | |
| Total Expenditures per Capita | $ 4,797 | 11 | 2021 | find more | |
| by End-Use Sector | Alabama | Share of U.S. | Period | ||
| Consumption | |||||
| » Residential | 339 trillion Btu | 1.6% | 2021 | find more | |
| » Commercial | 247 trillion Btu | 1.4% | 2021 | find more | |
| » Industrial | 825 trillion Btu | 2.5% | 2021 | find more | |
| » Transportation | 554 trillion Btu | 2.0% | 2021 | find more | |
| Expenditures | |||||
| » Residential | $ 4,729 million | 1.7% | 2021 | find more | |
| » Commercial | $ 3,155 million | 1.6% | 2021 | find more | |
| » Industrial | $ 4,618 million | 2.0% | 2021 | find more | |
| » Transportation | $ 11,722 million | 1.9% | 2021 | find more | |
| by Source | Alabama | Share of U.S. | Period | ||
| Consumption | |||||
| » Petroleum | 116 million barrels | 1.6% | 2021 | find more | |
| » Natural Gas | 764 billion cu ft | 2.4% | 2022 | find more | |
| » Coal | 15,856 thousand short tons | 3.1% | 2022 | find more | |
| Expenditures | |||||
| » Petroleum | $ 13,087 million | 1.7% | 2021 | find more | |
| » Natural Gas | $ 6,054 million | 2.2% | 2022 | find more | |
| » Coal | $ 929 million | 3.5% | 2022 | find more | |
| Consumption for Electricity Generation | Alabama | Share of U.S. | Period | find more | |
| Petroleum | 13 thousand barrels | 0.5% | Jan-24 | find more | |
| Natural Gas | 38,316 million cu ft | 3.3% | Jan-24 | find more | |
| Coal | 1,024 thousand tons | 2.4% | Jan-24 | find more | |
| Energy Source Used for Home Heating (share of households) | Alabama | U.S. Average | Period | ||
| Natural Gas | 25.3 % | 46.2 % | 2022 | ||
| Fuel Oil | 0.1 % | 3.9 % | 2022 | ||
| Electricity | 67.7 % | 41.3 % | 2022 | ||
| Propane | 5.3 % | 5.0 % | 2022 | ||
| Other/None | 1.5 % | 3.5 % | 2022 | ||
| Environment | |||||
|---|---|---|---|---|---|
| Renewable Energy Capacity | Alabama | Share of U.S. | Period | find more | |
| Total Renewable Energy Electricity Net Summer Capacity | 4,510 MW | 1.3% | Jan-24 | ||
| Ethanol Plant Nameplate Capacity | -- | -- | 2023 | ||
| Renewable Energy Production | Alabama | Share of U.S. | Period | find more | |
| Utility-Scale Hydroelectric Net Electricity Generation | 1,220 thousand MWh | 5.7% | Jan-24 | ||
| Utility-Scale Solar, Wind, and Geothermal Net Electricity Generation | 59 thousand MWh | 0.1% | Jan-24 | ||
| Utility-Scale Biomass Net Electricity Generation | 261 thousand MWh | 6.3% | Jan-24 | ||
| Small-Scale Solar Photovoltaic Generation | NM | NM | Jan-24 | ||
| Fuel Ethanol Production | 0 thousand barrels | 0.0% | 2021 | ||
| Renewable Energy Consumption | Alabama | U.S. Rank | Period | find more | |
| Renewable Energy Consumption as a Share of State Total | 15.4 % | 19 | 2021 | ||
| Fuel Ethanol Consumption | 7,315 thousand barrels | 17 | 2021 | ||
| Total Emissions | Alabama | Share of U.S. | Period | find more | |
| Carbon Dioxide | 108.4 million metric tons | 2.2% | 2021 | ||
| Electric Power Industry Emissions | Alabama | Share of U.S. | Period | find more | |
| Carbon Dioxide | 52,252 thousand metric tons | 3.2% | 2022 | ||
| Sulfur Dioxide | 27 thousand metric tons | 2.5% | 2022 | ||
| Nitrogen Oxide | 24 thousand metric tons | 2.0% | 2022 | ||
Analysis
Last Updated: October 19, 2023
Overview
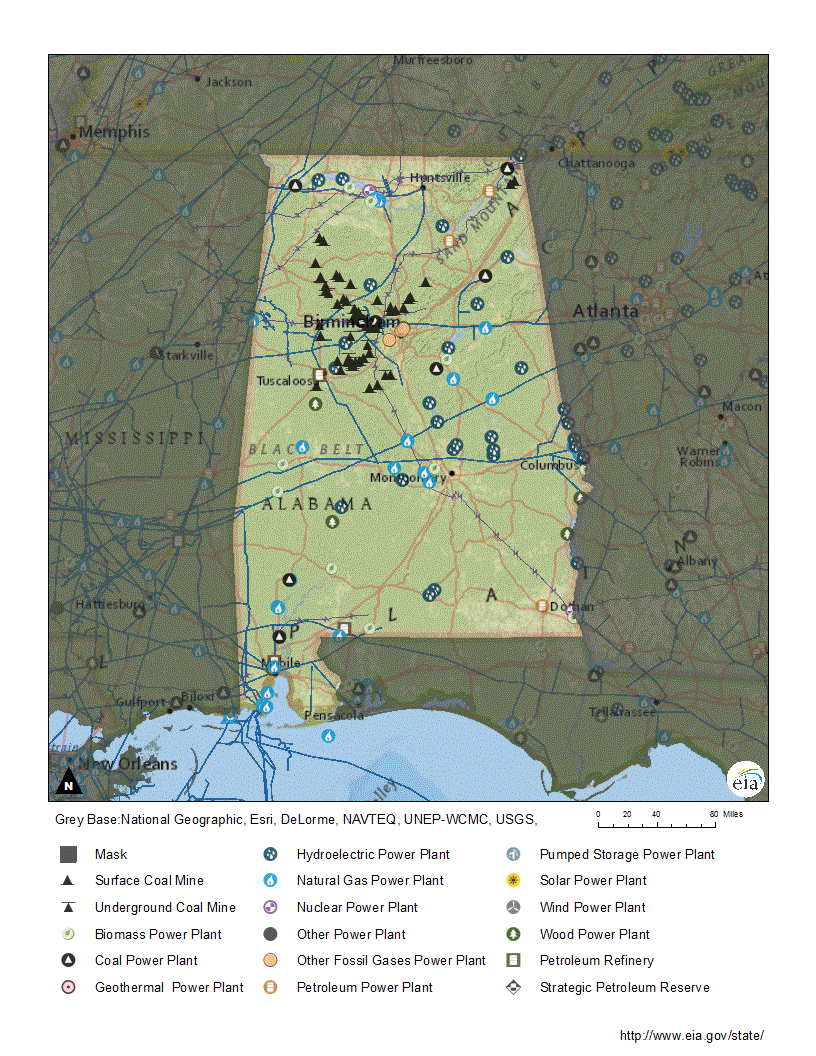
Alabama is an energy-rich state with a wide variety of resources, including deposits of coal, crude oil and natural gas, as well as renewable energy resources.1,2 Located along the Gulf of Mexico, southern Alabama consists of a coastal plain with a humid, subtropical climate. The state's north includes the southern edge of the Appalachian Mountains, where below-zero temperatures occur every few years and measurable snow is common.3,4 Alabama's many rivers flow from the Appalachian highlands toward the Gulf of Mexico, and several dams along those rivers provide hydroelectric power.5,6,7 Forests cover more than two-thirds of Alabama, and the state has the third-largest total timberland acreage among the Lower 48 states, after Georgia and Oregon, which gives Alabama ample biomass resources.8,9,10
Alabama ranks among the top 10 states in industrial sector energy consumption.
Alabama ranks among the 10 states with the highest total industrial sector energy use, and its industrial sector accounts for slightly more than two-fifths of the state's total energy consumption.11,12 Alabama is among the top five states in the manufacture of cars and light trucks, with a production capacity of 1.3 million vehicles annually. Vehicles are Alabama's No. 1 export, and it is the third-largest auto-exporting state. The manufacture of automobiles and other transportation equipment; primary metals; chemicals; food and beverages; paper; and wood products, as well as mining and oil and natural gas extraction, are major contributors to Alabama's economy.13,14,15 The transportation sector accounts for almost three-tenths of the state's total energy consumption. Alabama was one of only 12 states to see energy use in its transportation sector rise in 2021 from pre-Covid-19 pandemic levels, with the state having the third-largest increase, mostly because of more gasoline use for light-duty vehicle travel.16,17 Despite high energy use for cooling during the state's hot, humid summers and widespread home heating in the winter, the residential sector makes up slightly less than one-fifth of state energy use. The commercial sector accounts for about one-eighth of Alabama's energy consumption.18,19,20 Overall, Alabama consumes about 40% more energy than it produces.21
Electricity
Alabama ranks sixth among the states in the production of electricity.22 Natural gas has fueled the largest share of electricity in Alabama since 2014 and accounted for 43% of the state's net generation in 2022.23 Seven of the 10 largest power plants in Alabama by capacity and 6 of the largest by actual yearly electricity generation are natural gas-fired.24
The Browns Ferry power plant has the second-largest nuclear power generating capacity in the nation.
Alabama is the nation's fifth-largest producer of electricity from nuclear power.25 Alabama's two nuclear power plants, with a total of five reactors, produced 29% of the electricity generated in the state in 2022. The three reactors at the Tennessee Valley Authority's (TVA) Browns Ferry nuclear power plant in north Alabama have nearly 3,800 megawatts of combined generating capacity, which is the second-largest among U.S. nuclear power plants, after Arizona's Palo Verde nuclear power plant. Browns Ferry will rank third when the Unit 4 reactor at Georgia's Vogtle nuclear power plant comes online in late 2023 or early 2024.26,27,28
Coal historically fueled the largest share of electric power generation in Alabama, but many of the state's older coal-fired generating plants have shut down. About 4,200 megawatts of the state's coal-fired generating capacity has retired since 2015.29,30 The contribution of coal-fired power plants to Alabama's net generation dropped by more than half since 2010, declining to 18% of the state's total generation in 2022.31
Twenty-three hydroelectric dams on Alabama's rivers provided 7% of the state's net generation in 2022.32,33 Alabama is the sixth-largest U.S. hydroelectric power producer and second-largest east of the Rocky Mountains, after New York.34 Although only about 2% of the state's total generation is fueled by biomass, Alabama ranks fifth among the states in electricity generation from biomass. Almost all of that generation comes from burning wood and wood-derived fuels from the state's substantial forest products industry.35,36
Alabama's electricity production exceeds its consumption, and about one-third of the electricity generated in the state is sent to neighboring states over the regional electric grid.37,38 In 2022, Alabama's residential sector accounted for 38% of the electricity sold in the state, and the industrial sector accounted for 36%. The commercial sector made up 26% of the state's electricity sales.39 Total electricity consumption per capita in Alabama is fourth-highest in the nation and per capita electricity use in the residential sector ranks fifth, due in part to the high demand for air conditioning in the hot summers and the widespread use of electricity for home heating in the winter.40,41 About 7 out of 10 Alabama households heat with electricity.42
Coal
Mobile is the largest U.S. seaport for coal imports and fourth-largest for coal exports.
Coal has been mined commercially in Alabama since the 1850s, and coal supported development of the state's iron and steel industry.43 Alabama holds 1% of U.S. economically recoverable coal reserves. In 2021, the state ranked 12th in the nation in total coal production and 8th in terms of bituminous coal, the most abundant type of coal found in the United States. Bituminous coal is used to generate electricity and to make steel.44,45 About 85% of the coal produced in Alabama comes from 6 underground mines, and the rest comes from 14 surface mines.46 Nearly 90% of the coal mined in Alabama is exported to other countries.47 During 2022, the Mobile seaport ranked first in the nation for receiving U.S. coal imports, handling almost two-fifths of total coal imports, and fourth in shipping U.S. coal exports.48
About 10% of the coal mined in Alabama is used in the state, and half that coal is burned at power plants to generate electricity. Minor amounts of Alabama coal are delivered to coking plants and other industrial plants in several other states, primarily Florida and Oklahoma.49,50 Wyoming supplies more than three-fifths of the domestically produced coal consumed in Alabama. All of that Wyoming coal is delivered to power plants, which are the largest coal consumers in Alabama. The rest of the domestic coal consumed in Alabama arrives by railroad, river barge, and truck from about half a dozen other states.51
Petroleum
Alabama's economically recoverable crude oil reserves are small—only about 0.1% of the U.S. total.52 Oil was discovered in west-central Alabama in the mid-1940s a few miles from the border with Mississippi.53 Today, a small amount of crude oil is produced from fields in the northwestern and southwestern parts of the state.54,55 Since reaching a peak of about 22 million barrels in 1980, the state's annual crude oil production has generally declined during the last four decades. Although the state's crude oil production increased slightly between 2011 and 2013, output has fallen every year since then. Production in 2022 dropped below 4 million barrels for the first time the mid-1950s.56,57,58
Alabama’s three oil refineries combined can process about 142,000 barrels of crude oil per day.
Alabama has three petroleum refineries with a combined processing capacity of about 142,000 barrels of crude oil per calendar day. The state's largest refinery is located near Mobile. The second-largest refinery is in Tuscaloosa on the Black Warrior River, and the third and smallest refinery is in Atmore, located northeast of Mobile near the Florida Panhandle border.59 The refineries can process a range of domestic and imported crude oils into refined products that include: feedstocks for chemical plants, motor gasoline, jet fuel, diesel fuel, residual fuel, and asphalt for local and regional markets. The Mobile refinery began producing diesel fuel from renewable sources in early 2023.60,61,62,63 Alabama receives additional refined products from Texas and Louisiana via two major interstate pipelines—the Colonial Pipeline and the PPL Pipeline (formerly known as the Plantation Pipeline). These pipelines move gasoline and other petroleum products through Alabama to supply half a dozen other southern and eastern states.64,65,66
In 2021, nearly nine-tenths of the petroleum used in Alabama was consumed as transportation fuels, mainly motor gasoline and diesel fuel.67,68 Conventional gasoline without ethanol can be sold throughout the state, although almost all U.S. gasoline is blended with at least 10% ethanol.69,70 Alabama ranks third among states with the lowest average gasoline prices, but it is second-highest in the nation in gasoline expenditures per capita.71 Alabama does not have any ethanol production plants, but the state consumes about 307 million gallons of fuel ethanol per year.72,73 Alabama has one biodiesel production plant, which can produce 20 million gallons a year and is one-third less than the 30 million gallons of biodiesel the state consumes annually.74,75 The industrial sector consumes about 9% of the state's petroleum, the commercial sector accounts for about 2%, and the residential sector makes up about 1% of petroleum use. About 5 out of 100 Alabama households heat with petroleum products, mainly propane.76,77
Natural gas
Alabama produces natural gas both onshore and offshore in state waters, including in Mobile Bay. The state's proved reserves of natural gas have fallen to about one-fifth of their peak estimate in the early 1990s and now comprise about 0.2% of U.S. total natural gas reserves.78,79 Alabama's annual marketed natural gas production has steadily declined during the past two decades. In 2021, the state's natural gas output fell to its lowest level since the late 1970s and contributed about 0.3% to the nation's total natural gas production.80,81 Almost three-fifths of Alabama's natural gas production comes from onshore wells, and most of that onshore production is in the form of coalbed methane—a natural gas produced from coal seams. The state's coalbed methane wells are located primarily in the Black Warrior Basin in northwestern Alabama.82,83,84
Alabama's natural gas production meets about 15% of the state's gas demand.85,86 The state receives additional natural gas through interstate pipelines, mainly from Mississippi, but large volumes are also shipped south through Tennessee from Pennsylvania and Ohio natural gas fields in the Marcellus and Utica shales. More than four-fifths of the natural gas that enters Alabama continues on to other states, mainly to Georgia, Florida, and Mississippi.87
An increasing amount of the natural gas consumed in Alabama goes to power plants as fuel for electricity generation. Since 2007, the electric power sector has been the largest natural gas-consuming sector in the state and accounted for 62% of total natural gas deliveries in 2022. The industrial sector consumed the second-largest amount of natural gas—about 30% of the state's total.88,89 Although one-fourth of Alabama households use natural gas for heating, the residential sector accounted for only slightly more than 4% of the state's natural gas consumption because the winters are mild in much of the state. The commercial sector accounted for a little less than 4% of the state's natural gas use.90,91
Renewable energy
Hydropower provides 70% of Alabama’s renewable electricity generation.
In 2022, renewable energy sources generated about one-tenth of Alabama's total in-state electricity. Hydroelectric facilities accounted for 70% of the state's renewable electricity generation. About 22% of Alabama's renewable generation came from biomass, mostly from wood and wood-derived fuels at industrial facilities, and 6% was provided by solar energy.92,93 Alabama's biomass resources also provide feedstock for the state's three commercial wood pellet plants, which have a combined annual production capacity of 683,000 short tons—about 5% of the nation's total.94
Alabama's total solar power generation is small, but has increased in recent years.95 The state's best solar resources are located in the southeast corner of Alabama and along the state's short Gulf Coast shoreline.96 Alabama's first commercial solar farm, with 75 megawatts of solar photovoltaic (PV) generating capacity, began operating in 2016. A 227-megawatt solar farm in northwest Alabama, which is the state's largest, came online in late 2021 to supply power to a large computer data center. The state had 600 megawatts of installed utility-scale (1 megawatt or larger) solar power generating capacity as of mid-2023.97,98,99 There is currently little customer-sited, small-scale (less than 1 megawatt) solar generating capacity, such as residential rooftop solar panels, in the state.100,101
Alabama has no utility-scale wind generation, but there are a few areas along its Gulf coastline and along stretches of the Appalachian mountain ridges in the northeastern part of the state that have modest wind energy resources.102,103 In June 2021, the U.S. Department of the Interior published a request for proposals to see if there was any interest among energy companies in leasing tracts to develop wind power in federal Gulf of Mexico waters that begin three miles off the Alabama coast. However, the Department later determined there was not sufficient commercial interest in developing Alabama's offshore wind resources, and instead leased areas to develop wind resources in the Gulf of Mexico off the Louisiana and Texas coastlines.104,105,106
Alabama does not have a renewable portfolio standard or a voluntary renewable energy goal or offer net metering, but does encourage energy savings and efficiency.107,108 The state has an energy building code for commercial and residential buildings.109
Endnotes
1 U.S. Energy Information Administration (EIA), Annual Coal Report 2022 (October 3, 2023), Table 15, Recoverable Coal Reserves at Producing Mines, Estimated Recoverable Reserves, and Demonstrated Reserve Base by Mining Method, 2022.
2 U.S. EIA, U.S. Energy Atlas, All Energy Infrastructure and Resources, Alabama, accessed September 21, 2023.
3 University of Alabama, Department of Geography, Physiographic Regions, accessed September 21, 2023.
4 Christy, John, "Alabama's Climate, It's the Humidity!" Community Collaborative Rain, Hail & Snow Network, State Climate Series, accessed September 21, 2023.
5 Geology.com, Alabama Lakes, Rivers and Water Resources, accessed September 21, 2023.
6 Alabama Power, Lakes and Dams, accessed September 21, 2023.
7 Tennessee Valley Authority, TVA in Alabama, accessed September 21, 2023.
8 Hartselle, Andrew, "Alabama's Forests, 2015," U.S. Department of Agriculture, Forest Service, p. ix.
9 Alabama Forestry Commission, Alabama Forest Facts, accessed September 21, 2023.
10 Bragg, Bobby, "Alabama Timberland Acreage Is Up to 23 Million Acres," JamisonMoneyFarmer (July 20, 2015).
11 U.S. EIA, State Energy Data System, Table C14, Energy Consumption Estimates per Capita by End-Use Sector, Ranked by State, 2021.
12 U.S. EIA, State Energy Data System, Table C11, Energy Consumption Estimates by End-Use Sector, Ranked by State, 2021.
13 Alabama Department of Commerce, Made in Alabama, Industries, Targeted Business Sectors, accessed September 21, 2023.
14 Alabama Department of Commerce, Made in Alabama, Automotive, accessed September 21, 2023.
15 U.S. Bureau of Economic Analysis, Interactive Data, Regional Data, GDP and Personal Income, Annual Gross Domestic Product (GDP) by State, SAGPD4 GDP in current dollars, SAGDP2N - Gross domestic product (GDP) by state, Alabama, All statistics in table, 2021.
16 U.S. EIA, State Energy Data System, Table C11, Energy Consumption Estimates by End-Use Sector, Ranked by State, 2021.
17 U.S. EIA, "Energy use for transportation increased from pre-pandemic levels in 2021 in only 12 states," Today in Energy (September 13, 2023).
18 U.S. EIA, State Energy Data System, Table C11, Energy Consumption Estimates by End-Use Sector, Ranked by State, 2021.
19 U.S. Census Bureau, House Heating Fuel, Table B25040, 2022 ACS 1-Year Estimates Detailed Tables, Alabama.
20 U.S. EIA, Residential Energy Consumption Survey, 2020 RECs Survey Data, State Data, Housing characteristics, Highlights for air conditioning in U.S. homes by state, 2020, and Highlights for space heating in U.S. homes by state, 2020.
21 U.S. EIA, State Energy Data System, Table P3, Total Primary Production and Total Energy Consumption Estimates in Trillion Btu, 2021.
22 U.S. EIA, Electric Power Monthly (February 2023), Table 1.3.B.
23 U.S. EIA, Electricity Data Browser, Net generation for all sectors, annual, Alabama, 2001-22.
24 U.S. EIA, State Electricity Profiles, Alabama Electricity Profile 2021, Tables 2A, 2B.
25 U.S. EIA, Electric Power Monthly (February 2023), Table 1.9.B.
26 U.S. EIA, Electricity Data Browser, Net generation for all sectors, annual, Alabama, 2001-22.
27 U.S. EIA, Nuclear Reactor, State, and Net Capacity (September 2021).
28 Georgia Power, "Vogtle Unit 4 starts nuclear fuel load," Press Release (August 17, 2023).
29 U.S. EIA, Electricity Data Browser, Net generation for all sectors, annual, Alabama, 2001-22.
30 U.S. EIA, Preliminary Monthly Electric Generator Inventory (based on Form EIA-860M as a supplement to Form EIA-860), Inventory of Retired Generators as of August 2023, Plant State: Alabama, Technology: Conventional Steam Coal.
31 U.S. EIA, Electricity Data Browser, Net generation for all sectors, annual, Alabama, 2001-22.
32 U.S. EIA, Electricity Data Browser, Net generation for all sectors, annual, Alabama, 2001-22.
33 U.S. EIA, Preliminary Monthly Electric Generator Inventory (based on Form EIA-860M as a supplement to Form EIA-860), Inventory of Operating Generators as of August 2023, Plant State: Alabama, Technology: Conventional Hydroelectric.
34 U.S. EIA, Electric Power Monthly (February 2023), Table 1.10.B.
35 U.S. EIA, Electric Power Monthly (February 2023), Table 1.15.B.
36 U.S. EIA, Electricity Data Browser, Net generation for all sectors, annual, Alabama, 2001-22.
37 U.S. EIA, State Electricity Profiles, Alabama Electricity Profile 2021, Table 10, Supply and disposition of electricity, 1990 through 2021.
38 U.S. EIA, U.S. Energy Atlas, All Energy Infrastructure and Resources, Alabama, accessed September 22, 2023.
39 U.S. EIA, Electricity Data Browser, Retail sales of electricity (million kilowatthours), annual, Alabama, 2001-22.
40 U.S. EIA, Residential Energy Consumption Survey, 2020 RECs Survey Data, State Data, Housing characteristics, Highlights for air conditioning in U.S. homes by state, 2020, and Highlights for space heating in U.S. homes by state, 2020.
41 U.S. EIA, State Energy Data System, Table C17, Electricity Retail Sales, Total and Residential, Total and per Capita, Ranked by State, 2021.
42 U.S. Census Bureau, House Heating Fuel, Table B25040, 2022 ACS 1-Year Estimates Detailed Tables, Alabama.
43 Mining Artifacts, Alabama Mines, accessed September 23, 2023.
44 U.S. EIA, Annual Coal Report 2022 (October 3, 2023), Table 6, Coal Production and Number of Mines by State and Coal Rank, 2022; Table 15, Recoverable Coal Reserves at Producing Mines, Estimated Recoverable Reserves, and Demonstrated Reserve Base by Mining Method, 2022.
45 U.S. EIA, Energy Explained, Coal explained, Types of coal, Bituminous, updated October 19, 2022.
46 U.S. EIA, Annual Coal Report 2022 (October 3, 2023), Table 2, Coal Production and Number of Mines by State, County, and Mine Type, 2022.
47 U.S. EIA, Annual Coal Distribution Report 2022 (October 3, 2023), Domestic and foreign distribution of U.S. coal by origin State.
48 U.S. EIA, Quarterly Coal Report, 4th Quarter 2022 (April 2023), Table 13, U.S. Coal Exports by Customs District; Table 20, Coal Imports by Customs District.
49 U.S. EIA, Annual Coal Distribution Report 2022 (October 3, 2023), Domestic and foreign distribution of U.S. coal by origin State.
50 U.S. EIA, Annual Coal Distribution Report 2022 (October 3, 2023), Domestic Distribution of U.S. coal by origin State, consumer, destination and method of transportation, Table OS-1, Alabama, 2022.
51 U.S. EIA, Annual Coal Distribution Report 2022 (October 3, 2023), Domestic Distribution of U.S. coal by destination State, consumer, destination and method of transportation, Table DS-1, Alabama, 2022.
52 U.S. EIA, Crude Oil Proved Reserves, Reserves Changes, and Production, 2016-21.
53 Hall, Douglas R., and David E. Bolin, The Petroleum Industry in Alabama, 1999-2007, Oil and Gas Report 3U, Geological Survey of Alabama (2009), p. 1-2.
54 U.S. EIA, Crude Oil Production, Annual Thousand Barrels, 2017-22.
55 U.S. EIA, U.S. Energy Atlas, All Energy Infrastructure and Resources, Alabama, accessed September 23, 2023.
56 U.S. EIA, Alabama Field Production of Crude Oil (Thousand Barrels), 1981-2022.
57 U.S. EIA, State Energy Data System, Table PT1, Primary Energy Production Estimates in Physical Units, Alabama, 1960-2021.
58 State of Alabama Oil & Gas Board, State of Alabama Calendar Year Oil and Gas Production, 1944-2022.
59 U.S. EIA, Refinery Capacity Report 2023 (June 21, 2023), Table 3, Capacity of Operable Petroleum Refineries by State as of January 1, 2023.
60 Vertex Energy, Refining Operations, Mobile, AL, accessed September 23, 2023.
61 Goodway Refining, LLC, accessed September 23, 2023.
62 Hunt Refining Company, Refining Operations, Tuscaloosa Refinery, accessed September 23, 2023.
63 Brelsford, Robert, "Vertex Energy's Mobile refinery begins renewable diesel production," Oil & Gas Journal (May 1, 2023).
64 Colonial Pipeline Company, System Map, accessed September 23, 2023.
65 Kinder Morgan, Products (SE) Pipe Line Corporation, accessed September 23, 2023.
66 Kinder Morgan, Form 10-K, For the fiscal year ended December 31, 2020, Products Pipeline, Southeast Refined Products, PPL Pipeline, p. 10.
67 U.S. EIA, State Energy Data System, Table F16, Total Petroleum Consumption Estimates, 2021.
68 U.S. EIA, State Energy Data System, Table C2, Energy Consumption Estimates for Selected Energy Sources in Physical Units, 2021.
69 American Petroleum Institute, U.S. Gasoline Requirements, updated January 2018.
70 U.S. EIA, "Almost all U.S. gasoline is blended with 10% ethanol," Today in Energy (May 4, 2016).
71 U.S. EIA, Table E20, Motor Gasoline Price and Expenditure Estimates, Ranked by State, 2021.
72 U.S. EIA, U.S. Fuel Ethanol Plant Production Capacity (August 7, 2023), Detailed nameplate capacity of fuel ethanol plants by Petroleum Administration for Defense District (PAD District) are available in XLS file.
73 U.S. EIA, State Energy Data System, Table F25, Fuel ethanol consumption estimates, 2021.
74 U.S. EIA, U.S. Biodiesel Plant Production Capacity (August 7, 2023), Detailed annual production capacity by plant is available in XLSX format.
75 U.S. EIA, State Energy Data System, Table F26, Biodiesel Consumption Estimates, 2021.
76 U.S. EIA, State Energy Data System, Table F16, Total Petroleum Consumption Estimates, 2021.
77 U.S. Census Bureau, House Heating Fuel, Table B25040, 2022 ACS 1-Year Estimates Detailed Tables, Alabama.
78 U.S. EIA, Natural Gas Gross Withdrawals and Production, Gross Withdrawals, Annual, 2017-22.
79 U.S. EIA, Natural Gas Reserves Summary as of Dec. 31, Wet NG, 2016-21.
80 U.S. EIA, Alabama Natural Gas Marketed Production, 1967-2020.
81 U.S. EIA, Natural Gas Gross Withdrawals and Production, Marketed Production, Annual, 2017-22.
82 U.S. EIA, Natural Gas Gross Withdrawals and Production, Marketed Production, Annual, 2017-22.
83 U.S. EIA, Natural Gas Gross Withdrawals and Production, Gross Withdrawals from Coalbed Wells, Annual-Million cubic feet, 2016-21.
84 Encyclopedia of Alabama, Alabama Oil and Gas Regions, accessed September 23, 2023.
85 U.S. EIA, Natural Gas Gross Withdrawals and Production, Marketed Production, Annual, 2017-22.
86 U.S. EIA, Natural Gas Consumption by End Use, Alabama, Annual, 2017-22.
87 U.S. EIA, International and Interstate Movements of Natural Gas by State, Alabama, Annual, 2016-21.
88 U.S. EIA, Alabama Natural Gas Deliveries to Electric Power Customers, 1997-2022.
89 U.S. EIA, Natural Gas Consumption by End Use, Alabama, Annual, 2017-22.
90 U.S. Census Bureau, House Heating Fuel, Table B25040, 2022 ACS 1-Year Estimates Detailed Tables, Alabama.
91 U.S. EIA, Natural Gas Consumption by End Use, Alabama, Annual, 2017-22.
92 U.S. EIA, Electricity Data Browser, Net generation for all sectors, annual, Alabama, 2001-22.
93 U.S. EIA, Electric Power Monthly (February 2023), Table 1.15.B.
94 U.S. EIA, Monthly Densified Biomass Fuel Report (October 2, 2023), Table 1, Densified biomass fuel manufacturing facilities in the United States by state, region, and capacity, July 2023.
95 U.S. EIA, Electricity Data Browser, Net generation for all sectors, annual, Alabama, 2001-22.
96 National Renewable Energy Laboratory, Global Horizontal Solar Irradiance, accessed September 24, 2023.
97 Smith, Tom, "River Bend Solar Energy Center operational, selling solar power," Times Daily (November 20, 2016).
98 Sylvia, Tim, "Project enters service in Alabama, nearly doubling the state's installed solar capacity," PV Magazine (September 20, 2021).
99 U.S. EIA, Preliminary Monthly Electric Generator Inventory (based on Form EIA-860M as a supplement to Form EIA-860), Inventory of Operating Generators as of August 2023, Plant State: Alabama, Technology: Solar Photovoltaic.
100 U.S. EIA, Electricity Data Browser, Net generation for all sectors, annual, Alabama, 2001-22.
101 Solar Energy Industries Association, Alabama Solar, accessed September 24, 2023.
102 U.S. Department of Energy, Energy Efficiency and Renewable Energy, WINDExchange, Wind Energy in Alabama, Maps & Data, accessed September 24, 2023.
103 U.S. EIA, Electricity Data Browser, Net generation for all sectors, annual, Alabama, 2001-22.
104 U.S. Department of the Interior, "Interior Department to Explore Offshore Wind Potential in the Gulf of Mexico," Press Release (June 8, 2021).
105 U.S. Department of the Interior, "BOEM Designates Two Wind Energy Areas in Gulf of Mexico Press Release," (October 31, 2022).
106 U.S. Department of the Interior, "Biden-Harris Administration Announces First Ever Offshore Wind Lease Sale in the Gulf of Mexico," Press Release (July 20, 2023).
107 National Council of State Legislatures, State Renewable Portfolio Standards and Goals, updated August 13, 2021.
108 Alabama Department of Economic and Community Affairs, Alabama Energy and Residential Codes, accessed September 24, 2023.
109 NC Clean Energy Technology Center, DSIRE, Alabama Energy Code, updated March 10, 2023.
Other Resources
Energy-Related Regions and Organizations
- Coal Region: Interior
- Petroleum Administration for Defense District (PADD): 3
- North American Electric Reliability Corporation (NERC) ERO Enterprise: Regional Entities: SERC Reliability Corporation (SERC)
Other Websites
- Alabama Public Service Commission
- Alabama Department of Economic and Community Affairs (ADECA), Energy Division
- ADECA, Energy Division, Low-Income Home Energy Assistance Program (LIHEAP)
- ADECA, Energy Division, Alabama Weatherization Assistance Program
- EIA Gulf of Mexico Fact Sheet
- Alabama Department of Environmental Management
- Alabama Oil and Gas Board and Geological Survey
- UA Alabama Energy Transformation Initiative
- Auburn University Center for Bioenergy and Bioproducts
- EIA Alabama Flickr Album
- Southern States Energy Board
- Southeastern Power Administration
- Tennessee Valley Authority
- Alternative Fuels Data Center, Federal and State Laws and Incentives
- U.S. Department of Health and Human Services, Administration for Children and Families, Office of Community Services, Low Income Home Energy Assistance Program (LIHEAP)
- Benefits.Gov, Housing and Public Utilities
- NC Clean Energy Technology Center, Database of State Incentives for Renewables and Efficiency (DSIRE)
- National Association of Regulatory Utility Commissioners (NARUC)
- National Association of State Energy Officials (NASEO)
- National Conference of State Legislatures (NCSL), Research and Policy
- National Renewable Energy Laboratory (NREL), Geospatial Data Science Data and Tools
- U.S. Geological Survey (USGS), Publications
- Interstate Oil and Gas Compact Commission
- U.S. Department of the Interior, Bureau of Ocean Energy Management
- U.S. Geological Survey, Maps
- National Renewable Energy Laboratory, State and Local Planning for Energy (SLOPE)
- Lawrence Livermore National Laboratory, Energy Flow Charts
- EIA Status of U.S. Nuclear Outages
- EIA Natural Gas Storage Dashboard
- EIA Energy Disruptions
- U.S. Department of Agriculture (USDA), Rural Development, Energy Programs