Indiana Quick Facts
- In 2021, Indiana was the sixth-largest fuel ethanol producer in the nation. The state produced nearly 1.2 billion gallons of fuel ethanol, which accounted for almost 8% of U.S. total production.
- In 2022, Indiana was the nation’s third-largest coal consumer, after Texas and Missouri. Coal fueled 52% of Indiana's electricity net generation that year, the sixth-highest share of any state.
- Indiana's industrial sector is the state's largest energy consumer, accounting for 46% of Indiana's energy consumption in 2021. The state leads the nation in steelmaking, an energy-intensive industry, and manufactures almost 90% of the recreational vehicles sold in the nation.
- Indiana's Whiting refinery can process about 435,000 barrels of crude oil per calendar day and is the largest inland oil refinery in the nation. Only six U.S. refineries (three in Texas and three in Louisiana) can process more crude oil.
- In 2022, wind power provided 10% of Indiana’s total electricity net generation, and solar, biomass, and hydropower combined accounted for about 2%.
Last Updated: September 21, 2023
Data
Last Update: April 18, 2024 | Next Update: May 16, 2024
| Prices | |||||
|---|---|---|---|---|---|
| Petroleum | Indiana | U.S. Average | Period | find more | |
| Domestic Crude Oil First Purchase | $ 70.59 /barrel | $ 72.26 /barrel | Jan-24 | ||
| Natural Gas | Indiana | U.S. Average | Period | find more | |
| City Gate | $ 5.35 /thousand cu ft | $ 4.76 /thousand cu ft | Jan-24 | find more | |
| Residential | $ 8.20 /thousand cu ft | $ 11.82 /thousand cu ft | Jan-24 | find more | |
| Coal | Indiana | U.S. Average | Period | find more | |
| Average Sales Price | $ 56.67 /short ton | $ 54.46 /short ton | 2022 | ||
| Delivered to Electric Power Sector | W | $ 2.48 /million Btu | Jan-24 | ||
| Electricity | Indiana | U.S. Average | Period | find more | |
| Residential | 13.75 cents/kWh | 15.45 cents/kWh | Jan-24 | find more | |
| Commercial | 12.46 cents/kWh | 12.68 cents/kWh | Jan-24 | find more | |
| Industrial | 8.20 cents/kWh | 8.10 cents/kWh | Jan-24 | find more | |
| Reserves | |||||
|---|---|---|---|---|---|
| Reserves | Indiana | Share of U.S. | Period | find more | |
| Crude Oil (as of Dec. 31) | -- | -- | 2021 | find more | |
| Expected Future Production of Dry Natural Gas (as of Dec. 31) | -- | -- | 2021 | find more | |
| Expected Future Production of Natural Gas Plant Liquids | -- | -- | 2021 | find more | |
| Recoverable Coal at Producing Mines | 286 million short tons | 2.5% | 2022 | find more | |
| Rotary Rigs & Wells | Indiana | Share of U.S. | Period | find more | |
| Natural Gas Producing Wells | NA | NA | 2020 | find more | |
| Capacity | Indiana | Share of U.S. | Period | ||
| Crude Oil Refinery Capacity (as of Jan. 1) | 469,500 barrels/calendar day | 2.6% | 2023 | ||
| Electric Power Industry Net Summer Capacity | 26,668 MW | 2.2% | Jan-24 | ||
| Supply & Distribution | |||||
|---|---|---|---|---|---|
| Production | Indiana | Share of U.S. | Period | find more | |
| Total Energy | 742 trillion Btu | 0.8% | 2021 | find more | |
| Crude Oil | 4 thousand barrels per day | * | Jan-24 | find more | |
| Natural Gas - Marketed | 3,836 million cu ft | * | 2022 | find more | |
| Coal | 24,159 thousand short tons | 4.1% | 2022 | find more | |
| Total Utility-Scale Net Electricity Generation | Indiana | Share of U.S. | Period | find more | |
| Total Net Electricity Generation | 9,601 thousand MWh | 2.5% | Jan-24 | ||
| Utility-Scale Net Electricity Generation (share of total) | Indiana | U.S. Average | Period | ||
| Petroleum-Fired | 0.1 % | 0.4 % | Jan-24 | find more | |
| Natural Gas-Fired | 33.2 % | 42.2 % | Jan-24 | find more | |
| Coal-Fired | 53.2 % | 19.9 % | Jan-24 | find more | |
| Nuclear | 0.0 % | 18.2 % | Jan-24 | find more | |
| Renewables | 11.1 % | 18.8 % | Jan-24 | ||
| Stocks | Indiana | Share of U.S. | Period | find more | |
| Motor Gasoline (Excludes Pipelines) | 106 thousand barrels | 0.9% | Jan-24 | ||
| Distillate Fuel Oil (Excludes Pipelines) | 3,716 thousand barrels | 3.8% | Jan-24 | find more | |
| Natural Gas in Underground Storage | 99,808 million cu ft | 1.4% | Jan-24 | find more | |
| Petroleum Stocks at Electric Power Producers | 113 thousand barrels | 0.5% | Jan-24 | find more | |
| Coal Stocks at Electric Power Producers | 8,389 thousand tons | 6.9% | Jan-24 | find more | |
| Fueling Stations | Indiana | Share of U.S. | Period | ||
| Motor Gasoline | 2,881 stations | 2.6% | 2021 | ||
| Propane | 41 stations | 1.7% | Mar-24 | ||
| Electric Vehicle Charging Locations | 544 stations | 0.9% | Mar-24 | ||
| E85 | 235 stations | 5.5% | Mar-24 | ||
| Biodiesel, Compressed Natural Gas, and Other Alternative Fuels | 53 stations | 1.9% | Mar-24 | ||
| Consumption & Expenditures | |||||
|---|---|---|---|---|---|
| Summary | Indiana | U.S. Rank | Period | ||
| Total Consumption | 2,728 trillion Btu | 10 | 2021 | find more | |
| Total Consumption per Capita | 400 million Btu | 11 | 2021 | find more | |
| Total Expenditures | $ 31,140 million | 13 | 2021 | find more | |
| Total Expenditures per Capita | $ 4,570 | 13 | 2021 | find more | |
| by End-Use Sector | Indiana | Share of U.S. | Period | ||
| Consumption | |||||
| » Residential | 528 trillion Btu | 2.5% | 2021 | find more | |
| » Commercial | 364 trillion Btu | 2.1% | 2021 | find more | |
| » Industrial | 1,250 trillion Btu | 3.8% | 2021 | find more | |
| » Transportation | 586 trillion Btu | 2.2% | 2021 | find more | |
| Expenditures | |||||
| » Residential | $ 6,149 million | 2.2% | 2021 | find more | |
| » Commercial | $ 3,673 million | 1.8% | 2021 | find more | |
| » Industrial | $ 7,929 million | 3.4% | 2021 | find more | |
| » Transportation | $ 13,390 million | 2.2% | 2021 | find more | |
| by Source | Indiana | Share of U.S. | Period | ||
| Consumption | |||||
| » Petroleum | 139 million barrels | 1.9% | 2021 | find more | |
| » Natural Gas | 871 billion cu ft | 2.7% | 2022 | find more | |
| » Coal | 31,851 thousand short tons | 6.2% | 2022 | find more | |
| Expenditures | |||||
| » Petroleum | $ 15,610 million | 2.1% | 2021 | find more | |
| » Natural Gas | $ 7,228 million | 2.7% | 2022 | find more | |
| » Coal | $ 2,560 million | 9.6% | 2022 | find more | |
| Consumption for Electricity Generation | Indiana | Share of U.S. | Period | find more | |
| Petroleum | 20 thousand barrels | 0.7% | Jan-24 | find more | |
| Natural Gas | 24,009 million cu ft | 2.1% | Jan-24 | find more | |
| Coal | 2,681 thousand tons | 6.3% | Jan-24 | find more | |
| Energy Source Used for Home Heating (share of households) | Indiana | U.S. Average | Period | ||
| Natural Gas | 58.4 % | 46.2 % | 2022 | ||
| Fuel Oil | 0.6 % | 3.9 % | 2022 | ||
| Electricity | 31.1 % | 41.3 % | 2022 | ||
| Propane | 7.6 % | 5.0 % | 2022 | ||
| Other/None | 2.4 % | 3.5 % | 2022 | ||
| Environment | |||||
|---|---|---|---|---|---|
| Renewable Energy Capacity | Indiana | Share of U.S. | Period | find more | |
| Total Renewable Energy Electricity Net Summer Capacity | 4,874 MW | 1.4% | Jan-24 | ||
| Ethanol Plant Nameplate Capacity | 1,318 million gal/year | 7.5% | 2023 | ||
| Renewable Energy Production | Indiana | Share of U.S. | Period | find more | |
| Utility-Scale Hydroelectric Net Electricity Generation | 41 thousand MWh | 0.2% | Jan-24 | ||
| Utility-Scale Solar, Wind, and Geothermal Net Electricity Generation | 996 thousand MWh | 2.2% | Jan-24 | ||
| Utility-Scale Biomass Net Electricity Generation | 31 thousand MWh | 0.7% | Jan-24 | ||
| Small-Scale Solar Photovoltaic Generation | 19 thousand MWh | 0.4% | Jan-24 | ||
| Fuel Ethanol Production | 27,520 thousand barrels | 7.7% | 2021 | ||
| Renewable Energy Consumption | Indiana | U.S. Rank | Period | find more | |
| Renewable Energy Consumption as a Share of State Total | 7.8 % | 37 | 2021 | ||
| Fuel Ethanol Consumption | 7,354 thousand barrels | 16 | 2021 | ||
| Total Emissions | Indiana | Share of U.S. | Period | find more | |
| Carbon Dioxide | 166.4 million metric tons | 3.4% | 2021 | ||
| Electric Power Industry Emissions | Indiana | Share of U.S. | Period | find more | |
| Carbon Dioxide | 70,490 thousand metric tons | 4.3% | 2022 | ||
| Sulfur Dioxide | 31 thousand metric tons | 2.9% | 2022 | ||
| Nitrogen Oxide | 50 thousand metric tons | 4.1% | 2022 | ||
Analysis
Last Updated: September 21, 2023
Overview
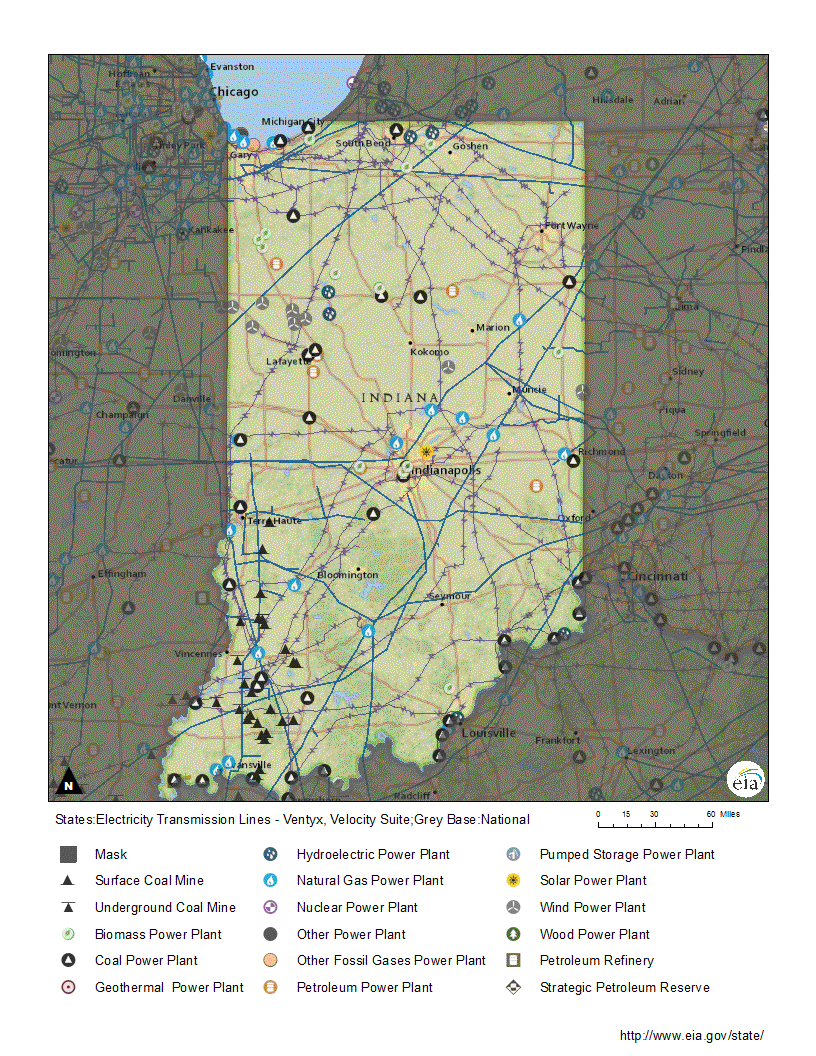
Indiana, a Great Lakes state, extends 270 miles south from Lake Michigan to the Ohio River at its southern border. The state is almost twice as long as it is wide, but, with the exception of Hawaii, it is the smallest state west of the Appalachians.1 Sediments deposited over millions of years, when much of the state was covered by inland seas and later by lush swamps, became the geologic layers that contain Indiana's fossil fuel resources, predominantly coal but also crude oil and some natural gas.2,3,4,5 The slightly rolling terrain in the northern two-thirds of the state is the result of the 2,000-foot-thick glacier that covered much of the state during the most recent Ice Age. The retreat of the glaciers more than 10,000 years ago left behind the fertile topsoil that supports Indiana's agriculture.6,7 Ample rainfall and rich prairie soils allow Indiana farmers to produce the abundant corn and soybean crops that are the feedstock for the state's ethanol and biodiesel industries.8,9,10 Indiana's open prairie also has excellent wind energy resources, and there are many large wind farms in west-central Indiana.11,12
Although Indiana is not a large state, it has a varied climate. In the north, Indiana experiences lake-effect snows and winds off Lake Michigan. In the south, the hilly terrain creates localized weather variations. The interplay of polar air moving south from Canada and warm, moist air moving north from the Gulf of Mexico influences the weather statewide. Indiana's winters can be bitterly cold, spring weather often includes tornadoes, and some summer days are very hot with high humidity.13 In part because of those weather extremes, Indiana ranked 11th among the states in total energy use per capita in 2021.14 The industrial sector was the state's largest energy-consuming sector and accounted for almost half of the state's total energy consumption.15 In addition to manufacturing almost 90% of the recreational vehicles sold in the nation, Indiana's industries include energy-intensive chemical and primary metal manufacturing, as well as petroleum refining.16,17 The transportation sector is the second-largest energy consumer in Indiana, followed closely by the residential sector. Those two sectors each account for about one-fifth of the state's energy use. The commercial sector uses the rest.18 Overall, Indiana consumes almost four times more energy than the state produces.19
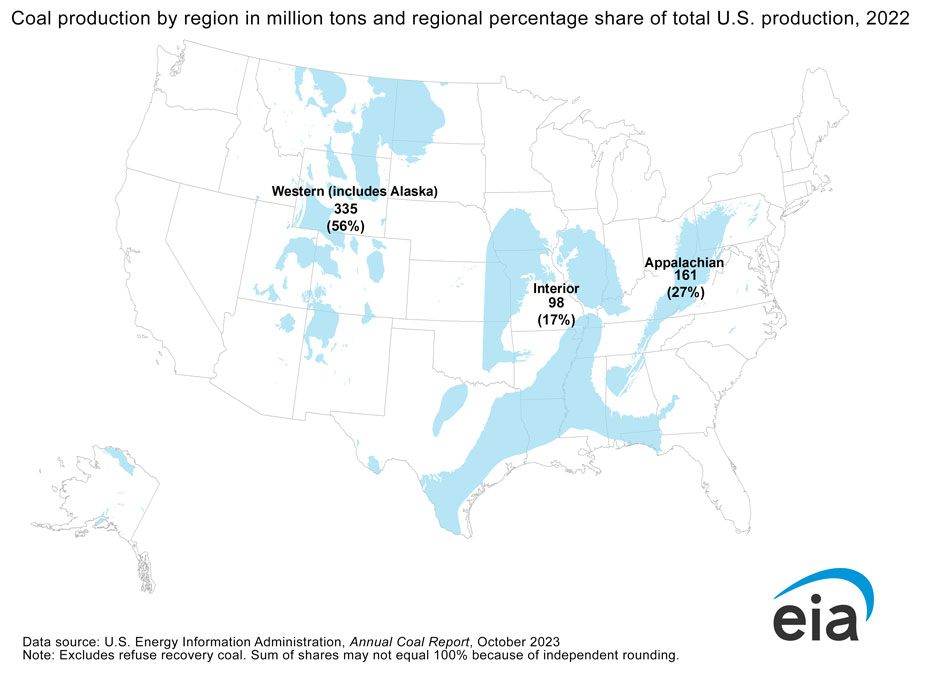
Coal
Indiana has about 1.5% of U.S. economically recoverable coal reserves.20 The state is the nation's fifth-largest producer of bituminous coal and the eighth-largest coal producer overall. In 2021, Indiana mines yielded almost 20 million tons of coal, which was more than 3% of the nation's total production.21 All of the state's coal mines are in southwestern Indiana within the coal-rich Illinois Basin.22 In 2021, Indiana used about four-fifths of its mined coal in-state and shipped most of the rest to almost a dozen other states by rail, barge, and truck.23 Indiana also exported about 5% of its mined coal to other countries.24
In 2022, Indiana was the nation’s third-largest coal consumer, after Texas and Missouri.
In 2022, Indiana was the nation's third-largest coal consumer, after Texas and Missouri. Indiana consumed 32 million tons of coal, and most of it was used for electric power generation.25 Even though Indiana is one of the nation's top coal producers, the coal mined in the state does not meet state demand.26,27 Almost all of the additional coal used in Indiana arrives by rail and barge from mines in West Virginia, Kentucky, Illinois, and Wyoming.28 In 2022, Indiana consumed almost 27 million tons of coal for electricity generation. Only Texas and Missouri used more coal for power generation. The industrial sector, which includes coke plants and other industrial users, accounted for most of the rest of the coal consumed in the state. Indiana ranks third in the nation in industrial sector coal use, after North Dakota and Pennsylvania.29 The state is a leader in steel manufacturing, and some of the coal used in Indiana goes to coking plants that supply the state's steel industry.30,31,32 However, the industrial sector's coal consumption has declined since 2010, and in 2022 it was about half of what it was in 2010. The commercial sector uses a small amount of coal.33
Electricity
Coal supplies the largest share of Indiana's total in-state utility-scale (1 megawatt or larger) electricity generation. In 2022, coal's share of the state's net generation was greater than in all but six other states.34 Eight of Indiana's largest power plants by capacity and by annual generation are coal-fired.35 However, coal-fired electricity generation in the state declined from 89% of total generation in 2010 to about 52% in 2022.36 About 5,600 megawatts of coal-fired capacity have retired since 2010, and another almost 4,400 megawatts of coal-fired capacity are scheduled for retirement during the next six years.37 At the same time, natural gas-fired generation has offset most of the decline in coal-fired generation. The share of the state's total net generation from natural gas increased from 5% in 2010 to 33% in 2022, after peaking at 36% in 2020.38 Renewable resources, primarily wind, supplied 12% of the state's total electricity net generation in 2022. More than 2% of Indiana's total net generation came from other gases used to fuel power generation at industrial facilities. Petroleum liquids and other energy sources fueled the rest of the state's total net generation.39
In 2022, Indiana ranked fifth in the nation in industrial sector electricity consumption.
In 2022, Indiana ranked 13th in the nation in total electricity sales, but the state was 5th in electricity sales to the industrial sector, which accounted for 43% of Indiana's electricity consumption.40,41 The residential sector, where 3 in 10 households use electricity as their primary energy source for home heating, accounted for 34% of state power use.42 The commercial sector consumed 23%.43 In part because of the retirement of several large coal-fired power plants, Indiana consumers used more electricity than in-state generators supplied in every year since 2012. In 2021, 16% of Indiana's electricity supply came from other states.44,45,46,47
Renewable energy
Renewable resources account for about 5,100 megawatts of Indiana's electricity generating capacity, which is almost one-fifth of the state's total.48 In 2022, renewable energy supplied 12% of the state's total electricity net generation. Wind energy contributed the largest share at about 10% of the state's total generation.49 Indiana's first utility-scale wind project came online in 2008 with about 130 megawatts of capacity.50 Today, wind turbines can be seen across central Indiana, and by mid-2023, the state had more than 3,450 megawatts of wind capacity.51,52
Indiana's solar, biomass, and hydroelectric facilities also are used to generate electricity. Southwestern Indiana has the state's best, although moderate, solar energy resources, but solar power facilities are found statewide.53 Utility-scale facilities, all solar photovoltaic (PV), provide four-fifths of the electricity generated from solar resources in Indiana. The rest is from small-scale (less than 1 megawatt) customer-sited installations like rooftop solar panels. Solar energy from all sources supplied about 1.5% of the state's total electricity net generation in 2022.54 Biomass and hydroelectric power provided the rest of the state's renewable-sourced net generation. Most of Indiana's biomass power plants are fueled with landfill gas, but other biomass resources, including animal waste and municipal solid waste, are used to generate electricity.55,56,57 Indiana has two wood pellet plants that use woody biomass to manufacture up to 7,000 tons of pellets each year, which can be used for electricity generation and space heating.58 In part because of its relatively level terrain, Indiana has only six utility-scale hydroelectric facilities.59 A 54-megawatt hydroelectric plant on the Ohio River at Indiana's southeastern boundary is the state's largest.60,61
In 2021, Indiana was the sixth-largest fuel ethanol producer in the nation.
Indiana's abundant corn crop provides the feedstock for biofuels production.62,63 The state has 14 fuel ethanol plants with a combined production capacity of more than 1.3 billion gallons per year.64 In 2021, Indiana was the sixth-largest producer of fuel ethanol in the nation. The state produced nearly 1.2 billion gallons of fuel ethanol, which accounted for almost 8% of U.S. total production.65 In 2021, Indiana consumed nearly 309 million gallons of fuel ethanol, about one-fourth as much as the state produced.66 Indiana is also the nation's fifth-largest producer of biodiesel. The state's 2 biodiesel plants have a combined production capacity of 102 million gallons per year, accounting about 5% of the nation's total capacity.67 In 2021, Indiana produced about 89 million gallons of biodiesel.68 However, the state consumed only about 39 million gallons, which was 2% of the U.S. total.69
Although Indiana's legislature created a voluntary clean energy portfolio standard in 2011, as of 2021, no Indiana utility had chosen to participate. If an electric utility elects to participate, it agrees to acquire 10% of the electricity it sells from clean energy sources by 2025. In return, the utility receives financial incentives.70 However, Indiana utilities must offer net metering to all customer-sited renewable generating facilities with less than 1 megawatt of capacity unless net metering exceeds 1% of a utility's most recent peak summer load.71
Petroleum
Indiana's proved crude oil reserves are modest and production was about 1.7 million barrels in 2022.72,73 Crude oil deposits were discovered in east-central Indiana in 1886. However, reserves were depleted, and production declined sharply in the early 20th century. As a result, the center of the state's crude oil production shifted to the Illinois Basin in southwestern Indiana. The state's crude oil output peaked at almost 13 million barrels per year in 1956.74 In 2020, the state's annual crude oil production dropped to 1.4 million barrels, which was its lowest level in more than 40 years.75 Output has increased slightly since then, but Indiana accounted for less than 0.04% of the nation's total crude oil production in 2022.76
The Whiting refinery in Indiana is the largest inland crude oil refinery in the nation.
Indiana has the largest inland crude oil refinery in the nation; only six Gulf Coast refineries have greater capacities.77 Indiana's two petroleum refineries' combined capacity is 469,500 barrels per calendar day, or about 3% of the U.S. total.78 The Whiting refinery, located in northwestern Indiana, is the seventh-largest U.S. refinery and can process about 435,000 barrels of crude oil per calendar day. That refinery produces large quantities of motor gasoline, diesel fuel, and jet fuel, as well as about 7% of the nation's asphalt.79 A second, small refinery, located in Mount Vernon at the southern tip of Indiana, processes crude oil from southern Indiana, southern Illinois, and western Kentucky. Its refined products include motor gasoline, diesel fuel, and lubricants that are delivered to customers in the region.80
The transportation sector uses more than three-fourths of the petroleum consumed in Indiana. Almost half of that is in the form of motor gasoline, and three-tenths is distillate fuel oil, mostly diesel fuel.81,82 Motor gasoline without ethanol can be sold in most of Indiana, but reformulated motor gasoline blended with ethanol is required in the state's northwestern corner near Chicago. Additionally, motor gasoline formulated to reduce the emissions that contribute to ground-level ozone is required during the summer months in southeastern Indiana near Louisville, Kentucky.83,84 The industrial sector is the state's second-largest petroleum consumer and accounts for slightly more than one-sixth of the petroleum used in the state. The commercial and residential sectors consume nearly all the rest in almost equal amounts.85 About 8% of Indiana's homes heat with petroleum products, about 7% use propane, and fewer than 1% use fuel oil or kerosene.86 The electric power sector accounts for about 0.1% of the state's petroleum consumption.87,88
Natural gas
Indiana is one of the nation’s top 10 natural gas-consuming states.
Indiana does not have significant natural gas reserves, but the state does produce some natural gas.89 The number of wells completed using hydraulic fracturing increased the state's natural gas production, which peaked at 9 billion cubic feet in 2011. However, the state's annual output was only about 4 billion cubic feet in 2021, which was about 0.01% of the U.S. total.90,91 Many of the state's natural gas fields are in east-central Indiana, where natural gas was first discovered in the mid-1870s, and the availability of advanced drilling technologies has renewed interest in a shallow natural gas play in the New Albany Shale in southwestern Indiana. Shallow coalbed methane resources also are found in southwestern Indiana.92
Many interstate natural gas pipeline systems cross Indiana, bringing natural gas into the state primarily through Ohio and Illinois.93 In 2021, Indiana consumed or stored one-third of the natural gas that entered the state. Most of the rest continued on to Illinois, Kentucky, Ohio, and Michigan.94 Some of the natural gas that entered Indiana was placed in underground natural gas storage reservoirs for later use. The state has 23 natural gas underground storage fields whose combined total storage capacity of more than 113 billion cubic feet is about 1% of the nation's total.95,96
Indiana is one of the top 10 natural gas-consuming states, and it ranks 13th in per capita natural gas use.97 The industrial sector is the state's largest natural gas consumer, accounting for 44% of the natural gas delivered to Indiana consumers in 2022. As more natural gas-fired power plants have come online, consumption of natural gas by the state's electric power sector has increased. In 2022, natural gas use for electricity generation accounted for 27% of state consumption. Almost four times as much natural gas was used for power generation than in 2010. The electric power sector's natural gas consumption has exceeded that of the residential sector since 2016.98 In 2022, the residential sector, where almost three in five households use natural gas for space heating, received about 17% of the natural gas delivered to Indiana consumers, and the commercial sector used about 12%. A small amount of natural gas was delivered to the transportation sector.99,100
Endnotes
1 NETSTATE, Indiana, The Geography of Indiana, updated February 25, 2016.
2 Gray, Henry H., Nautiloids: Shelled Marauders of Indiana's Ordovician Seas, Indiana Geological and Water Survey, accessed July 31, 2023.
3 U.S. Energy Information Administration (EIA), Annual Coal Report 2021 (October 2022), Table 15, Recoverable Coal Reserves at Producing Mines, Estimated Recoverable Reserves, and Demonstrated Reserve Base by Mining Method, 2021.
4 U.S. EIA, Crude Oil Production, Annual, 2017-22.
5 U.S. EIA, Natural Gas Gross Withdrawals and Production, Gross Withdrawals, Annual, 2017-21.
6 NETSTATE, Indiana, The Geography of Indiana, updated February 25, 2016.
7 City-Data, Indiana-Topography, accessed July 31, 2023.
8 Scheeringa, Ken, Indiana: "Don't like the weather? Just wait a few minutes and it will change," Indiana's Climate, The CoCoRaHS ‘State Climates' Series, accessed July 31, 2023.
9 U.S. Department of Agriculture, 2022 State Agriculture Overview, Indiana.
10 U.S. EIA, State Energy Data System, Table P4B, Primary Energy Production Estimates, Biofuels in Thousand Barrels, Ranked by State, 2021.
11 U.S. Department of Energy, Office of Energy Efficiency and Renewable Energy, WINDExchange, Indiana 80-Meter Wind Resource Map (October 18, 2010).
12 U.S. EIA, Indiana Profile Overview, Interactive GIS Data Viewer, Wind Power Plants Map Layer, accessed July 31, 2023.
13 National Oceanic and Atmospheric Administration, NOAA National Centers for Environmental Information, State Climate Summaries 2022, Indiana, Narrative.
14 U.S. EIA, State Energy Data System, Table C14, Total Energy Consumption Estimates per Capita by End-Use Sector, Ranked by State, 2021.
15 U.S. EIA, State Energy Data System, Table F35, Total Energy Consumption, Price, and Expenditure Estimates, 2021.
16 Dick, Gerry, "RV Sector Weathering Economy…For Now," Inside Indiana Business (May 16, 2022).
17 U.S. Bureau of Economic Analysis, Interactive Data, Regional Data, GDP & Personal Income, Annual Gross Domestic Product (GDP) by State, GDP in Current Dollars, Classification NAICS, Indiana, All statistics in the table, 2021.
18 U.S. EIA, State Energy Data System, Table F35, Total Energy Consumption, Price, and Expenditure Estimates, 2021.
19 U.S. EIA, State Energy Data System, Table P3, Total Primary Energy Production and Total Energy Consumption Estimates in Trillion Btu, 2021.
20 U.S. EIA, Annual Coal Report 2021 (October 2022), Table 15, Recoverable Coal Reserves at Producing Mines, Estimated Recoverable Reserves, and Demonstrated Reserve Base by Mining Method, 2021.
21 U.S. EIA, Annual Coal Report 2021 (October 2022), Table 6, Coal Production and Number of Mines by State and Coal Rank, 2021.
22 U.S. EIA, Indiana Profile Overview, Interactive GIS Data Viewer, Coal Mines and Coal Fields Map Layers, accessed July 31, 2023.
23 U.S. EIA, Annual Coal Distribution Report 2021 (October 2022), Domestic Distribution of U.S. Coal, by Coal Origin State, Table OS-6, Domestic Coal Distribution, by Origin State, 2021, Indiana.
24 U.S. EIA, Annual Coal Distribution Report 2021 (October 2022), U.S. Domestic and Foreign Coal Distribution by State of Origin.
25 U.S. EIA, Coal Data Browser, Total Consumption (Short tons), All states, Electric power (total), Commercial and institutional, Coke plants, Other industrial, Annual, 2022.
26 U.S. EIA, Annual Coal Report 2021 (October 2022), Table 6, Coal Production and Number of Mines by State and Coal Rank, 2021.
27 U.S. EIA, Annual Coal Report 2021 (October 2022), Table 26, U.S. Coal Consumption by End Use Sector, Census Division, and State, 2021 and 2020.
28 U.S. EIA, Annual Coal Distribution Report 2021 (October 2022), Domestic Distribution of U.S. Coal, By Coal Destination State, Indiana, Table DS-12, Domestic Coal Distribution, by Destination State, 2021.
29 U.S. EIA, Coal Data Browser, Total Consumption (Short tons), All states, Coke plants, Other industrial, Annual, 2022.
30 Brown, Alex, "Indiana Leads U.S. Steel Production," Inside Indiana Business (March 11, 2019).
31 U.S. EIA, Annual Coal Distribution Report 2021 (October 2022), Domestic Distribution of U.S. Coal, By Coal Destination State, Indiana, Table DS-12, Domestic Coal Distribution, by Destination State, 2021.
32 "How does coke and coal play into steel making?," Federal Steel Supply Inc. (June 22, 2016).
33 U.S. EIA, Coal Data Browser, Total Consumption (Short tons), Indiana, Electric power, Commercial and institutional, Coke plants, Other industrial, Annual, 2000-22.
34 U.S. EIA, Electric Power Monthly (February 2023), Tables 1.3.B, 1.4.B.
35 U.S. EIA, State Electricity Profiles, Indiana Electricity Profile 2021, Tables 2A, 2B.
36 U.S. EIA, Electricity Data Browser, Net generation for all sectors, Indiana, Coal, Small-scale solar photovoltaic, Annual, 2001-22.
37 U.S. EIA, Preliminary Monthly Electric Generator Inventory (based on Form EIA-860M as a supplement to Form EIA-860, Inventory of Operating Generators as of July 2023, and Inventory of Retired Generators as of July 2023.
38 U.S. EIA, Electricity Data Browser, Net generation for all sectors, Indiana, All fuels (utility-scale), Natural gas, Small-scale solar photovoltaic, Annual, 2001-22.
39 U.S. EIA, Electricity Data Browser, Net generation for all sectors, Indiana, Fuel Type, Check all, Annual, 2022.
40 U.S. EIA, Electricity Data Browser, Retail sales of electricity, All states, All sectors, Annual, 2022.
41 U.S. EIA, Electricity Data Browser, Retail sales of electricity, All states, Industrial sector, Annual, 2022.
42 U.S. Census Bureau, American Community Survey, House Heating Fuel, Table 25040, Home Heating Fuel, 2021 American Community Survey 1-Year Estimates, Indiana.
43 U.S. EIA, Electricity Data Browser, Retail sales of electricity, All states, All sectors, Residential, Commercial, Industrial, Transportation, Other, Annual, 2022.
44 U.S. EIA, Preliminary Monthly Electric Generator Inventory (based on Form EIA-860M as a supplement to Form EIA-860, Inventory of Retired Generators as of July 2023.
45 U.S. EIA, Electricity Data Browser, Net generation for all sectors, Indiana, Fuel Type, Check all, Annual, 2022.
46 U.S. EIA, Electricity Data Browser, Retail sales of electricity, Indiana, All sectors, Annual, 2022.
47 U.S. EIA, Indiana Electricity Profile 2021, Table 10, Supply and disposition of electricity, 1990 through 2021.
48 U.S. EIA, Electric Power Monthly (August 2023), Tables 6.2.A, 6.2.B.
49 U.S. EIA, Electricity Data Browser, Net generation all sectors, Indiana, All fuels (utility-scale), Conventional hydroelectric, Other renewables (total), Wind, Small-scale solar photovoltaic, Annual, 2022.
50 U.S. EIA, Preliminary Monthly Electric Generator Inventory (based on Form EIA-860M as a supplement to Form EIA-860, Inventory of Operating Generators as of July 2023.
51 U.S. EIA, Indiana Profile Overview, Interactive GIS Data Viewer, Wind Power Plants Map Layer, accessed July 31, 2023.
52 U.S. EIA, Electric Power Monthly (August 2023), Table 6.2.B.
53 U.S. EIA, Indiana Profile Overview, Interactive GIS Data Viewer, Solar Power Plants and Solar Resources Map Layers, accessed August 11, 2023.
54 U.S. EIA, Electricity Data Browser, Net generation all sectors, Indiana, All fuels (utility-scale), All utility-scale solar, Small-scale solar photovoltaic, Annual, 2022.
55 U.S. EIA, Preliminary Monthly Electric Generator Inventory (based on Form EIA-860M as a supplement to Form EIA-860, Inventory of Operating Generators as of July 2023.
56 U.S. EIA, Indiana Profile Overview, Interactive GIS Data Viewer, Biomass Power Plants Map Layer, accessed August 11, 2023.
57 Big Town Ag, The Operation, accessed August 11, 2023.
58 U.S. EIA, Monthly Densified Biomass Fuel Report, Table 1, Densified biomass fuel manufacturing facilities in the United States by state, region, and capacity, May 2023.
59 NETSTATE, Indiana, The Geography of Indiana, The Land, updated February 25, 2016.
60 U.S. EIA, Indiana Profile Overview, Interactive GIS Data Viewer, Hydroelectric Power Plant Map Layer, accessed August 11, 2023.
61 U.S. EIA, Preliminary Monthly Electric Generator Inventory (based on Form EIA-860M as a supplement to Form EIA-860, Inventory of Operating Generators as of July 2023.
62 U.S. Department of Agriculture, 2022 State Agriculture Overview, Indiana.
63 Ethanol Producer Magazine, Plant List, accessed August 1, 2023.
64 U.S. EIA, U.S. Fuel Ethanol Plant Production Capacity, as of January 1, 2023.
65 U.S. EIA, State Energy Data System, Table P4B, Primary Energy Production Estimates, Biofuels in Thousand Barrels, Ranked by State, 2021.
66 U.S. EIA, State Energy Data System, Table F25, Fuel ethanol consumption estimates, 2021.
67 U.S. EIA, U.S. Biodiesel Plant Production Capacity, as of January 1, 2023.
68 U.S. EIA, State Energy Data System, Table P4B, Primary Energy Production Estimates, Biofuels in Thousand Barrels, Ranked by State, 2021.
69 U.S. EIA, State Energy Data System, Table F26, Biodiesel Consumption Estimates, 2021.
70 Indiana Utility Regulatory Commission, 2021 Annual Report, p. 36-37.
71 NC Clean Energy Technology Center, DSIRE, Indiana, Net Metering, updated March 21, 2023.
72 U.S. EIA, Indiana Crude Oil Proved Reserves, Annual, 1977-2017.
73 U.S. EIA, Crude Oil Production, Annual, 2017-22.
74 Indiana Geological and Water Survey, Indiana Geology, A Brief Overview of the History of the Petroleum Industry In Indiana, Trenton Field, accessed August 11, 2023.
75 U.S. EIA, Indiana Field Production of Crude Oil, Annual, 1981-2022.
76 U.S. EIA, Crude Oil Production, Annual, 2017-22.
77 U.S. EIA, Oil: Crude and Petroleum Products Explained, Refining Crude Oil, Top 10 U.S. refineries operable capacity, as of January 1, 2023.
78 U.S. EIA, Number and Capacity of Petroleum Refineries, Indiana, and United States, 2023.
79 BP, United States, Whiting Refinery, updated March 2023.
80 CountryMark, About Us, Refinery, accessed August 11, 2023.
81 U.S. EIA, State Energy Data System, Table, F16, Total Petroleum Consumption Estimates, 2021.
82 U.S. EIA, State Energy Data System, Table C3, Primary Energy Consumption Estimates, 2021.
83 U.S. Environmental Protection Agency, Gasoline Standards, State Fuels, updated June 30, 2023.
84 Larson, B. K., U.S. Gasoline Requirements As of January 2018, ExxonMobil, accessed August12, 2023.
85 U.S. EIA, State Energy Data System, Table, F16, Total Petroleum Consumption Estimates, 2021.
86 U.S. Census Bureau, American Community Survey, House Heating Fuel, Table 25040, Home Heating Fuel, 2021 American Community Survey 1-Year Estimates, Indiana.
87 U.S. EIA, Electricity Data Browser, Net generation all sectors, Indiana, All fuels (utility-scale), Petroleum liquids, Annual, 2022.
88 U.S. EIA, State Energy Data System, Table C3, Primary Energy Consumption Estimates, 2021.
89 U.S. EIA, Natural Gas Reserves Summary as of December 31, Dry Natural Gas, Annual, 2016-21.
90 U.S. EIA, Indiana Natural Gas Gross Withdrawals, 1967-2021.
91 U.S. EIA, Natural Gas Gross Withdrawals and Production, Gross Withdrawals, Annual, 2017-22.
92 Indiana Geological and Water Survey, A Brief Overview of the History of the Petroleum Industry in Indiana, accessed August 12, 2023.
93 U.S. EIA, Indiana Profile Overview, Interactive GIS Data Viewer, Natural Gas Pipelines Map Layer, accessed August 12, 2023.
94 U.S. EIA, International & Interstate Movements of Natural Gas by State, Indiana, Annual, 2016-21.
95 U.S. EIA, Underground Natural Gas Storage Capacity, Total Number of Existing Fields, Annual, 2016-21.
96 U.S. EIA, Underground Natural Gas Storage Capacity, Total Storage Capacity, Annual, 2016-21.
97 U.S. EIA, State Energy Data System, Table C16, Natural Gas Consumption Estimates, Total and per Capita, Ranked by State, 2021.
98 U.S. EIA, Indiana Natural Gas Deliveries to Electric Power Consumers, 1997-2022.
99 U.S. Census Bureau, American Community Survey, House Heating Fuel, Table 25040, Home Heating Fuel, 2021 American Community Survey 1-Year Estimates, Indiana.
100 U.S. EIA, Natural Gas Consumption by End Use, Indiana, Annual, 2017-22.
Other Resources
Energy-Related Regions and Organizations
- Coal Region: Interior
- Petroleum Administration for Defense District (PADD): 2
- Regional Transmission Organization (RTO) and Independent System Operator (ISO): Midcontinent Independent System Operator (MISO), PJM Interconnection (PJM)
- North American Electric Reliability Corporation (NERC) ERO Enterprise: Regional Entities: Reliability First Corporation (RFC)
Other Websites
- Indiana Office of Energy Development
- Indiana Department of Environmental Management
- Indiana Utility Regulatory Commission
- Indiana Office of Utility Consumer Counselor
- Indiana Department of Natural Resources, Coal in Indiana
- Indiana Housing and Community Development Authority, Energy Assistance Program (EAP)
- Indiana Department of Natural Resources, Division of Oil and Gas
- Indiana Natural Resources Commission
- Indiana Geological & Water Survey, Coal
- Indiana Geological & Water Survey, Oil and Gas
- Indiana Geological & Water Survey, Geothermal Resources
- Indiana Office of Energy Development, Energy Efficiency & Demand Response
- EIA Indiana Flickr Album
- U.S. Department of Agriculture (USDA), Rural Development, Energy Programs
- U.S. Department of Health and Human Services, Administration for Children and Families, Office of Community Services, Low Income Home Energy Assistance Program (LIHEAP)
- Alternative Fuels Data Center, Federal and State Laws and Incentives
- Benefits.Gov, Housing and Public Utilities
- NC Clean Energy Technology Center, Database of State Incentives for Renewables and Efficiency (DSIRE)
- National Association of Regulatory Utility Commissioners (NARUC)
- National Association of State Energy Officials (NASEO)
- National Conference of State Legislatures (NCSL), Research and Policy
- National Renewable Energy Laboratory (NREL), Geospatial Data Science Data and Tools
- U.S. Geological Survey (USGS), Publications
- Interstate Oil and Gas Compact Commission
- U.S. Geological Survey, Maps
- Lawrence Livermore National Laboratory, Energy Flow Charts
- National Renewable Energy Laboratory, State and Local Planning for Energy (SLOPE)
- EIA Natural Gas Storage Dashboard
- U.S. Nuclear Regulatory Commission, Indiana
- EIA Energy Disruptions