
U.S. ENERGY INFORMATION ADMINISTRATION
WASHINGTON DC 20585
FOR IMMEDIATE RELEASE
September 13, 2018
EIA introduces interactive dashboard detailing natural gas storage activity
Today the U.S. Energy Information Administration (EIA) released a new interactive Natural Gas Storage Dashboard with daily and weekly information that provides a broader context to the data released in EIA’s Weekly Natural Gas Storage Report (WNGSR). The new dashboard gives users a comprehensive way to identify Lower 48 and regional storage activity and the key market fundamentals that affect underground natural gas storage activity.
The WNGSR is one of the U.S. government's Principal Federal Economic Indicators. Most of these indicators, which include metrics like employment, international trade, housing construction, and crop production, are released on a quarterly or monthly basis.
EIA will post updates to the dashboard in the mid-afternoon on the same days EIA releases its latest weekly natural gas storage estimates, which are usually on Thursdays. The dashboard will follow the same holiday reporting schedule as the WNGSR.
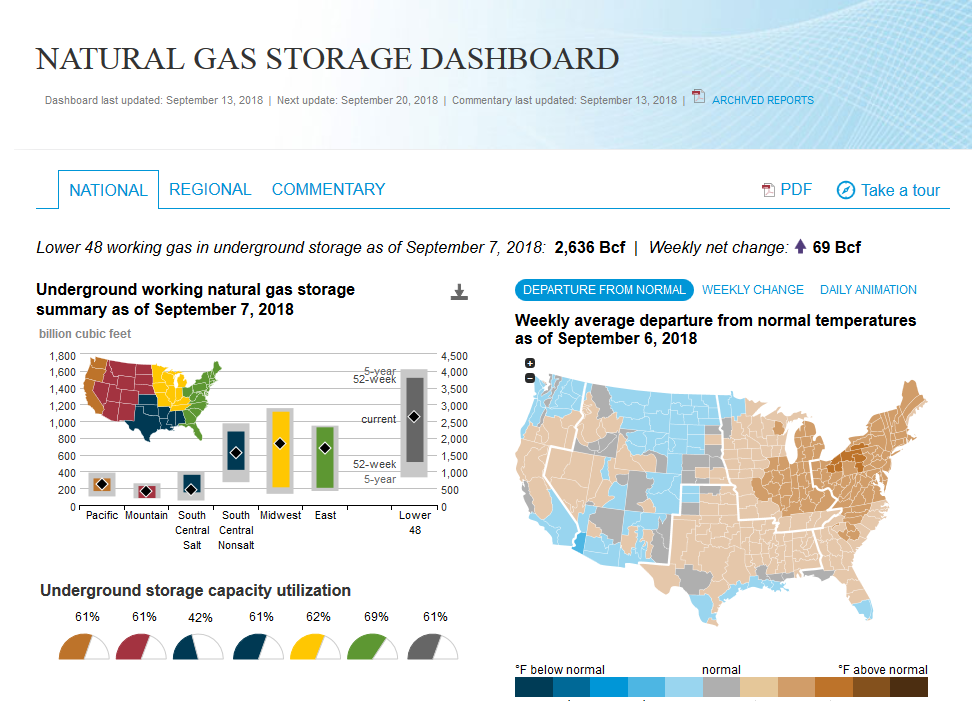
The dashboard includes the Lower 48 and regional natural gas storage inventories, net inventory changes, and utilization indicators. Other metrics include temperature visualizations, estimated natural gas consumption by sector, net exports, and futures prices.
Information sources used reflect a combination of EIA and third-party data. Key sources of non-EIA data include temperature data from the National Oceanic and Atmospheric Administration (NOAA), natural gas demand and import/export data from OPIS PointLogic, and natural gas futures prices from CME Group and Bloomberg.
EIA has incorporated many interactive features into the dashboard, such as the ability to select national or regional information, choose specific years or ranges, animate trends, and download selected data series or images. In addition to the data visualizations, the commentary tab will provide more context on recent natural gas storage-related market conditions. These entries will focus on many aspects of the natural gas storage market, such as potential drivers of changes in storage inventories, occasional details on EIA-derived storage statistics, and trends on natural gas storage infrastructure.
The Natural Gas Storage Dashboard can be found at:
https://www.eia.gov/naturalgas/storage/dashboard/
EIA Program Contact: Chris Peterson, 202-586-4804, Christopher.Peterson@eia.gov
EIA Press Contact: Jonathan Cogan, 202-586-8719, Jonathan.Cogan@eia.gov
EIA-2018-06