Natural gas
Natural gas storage
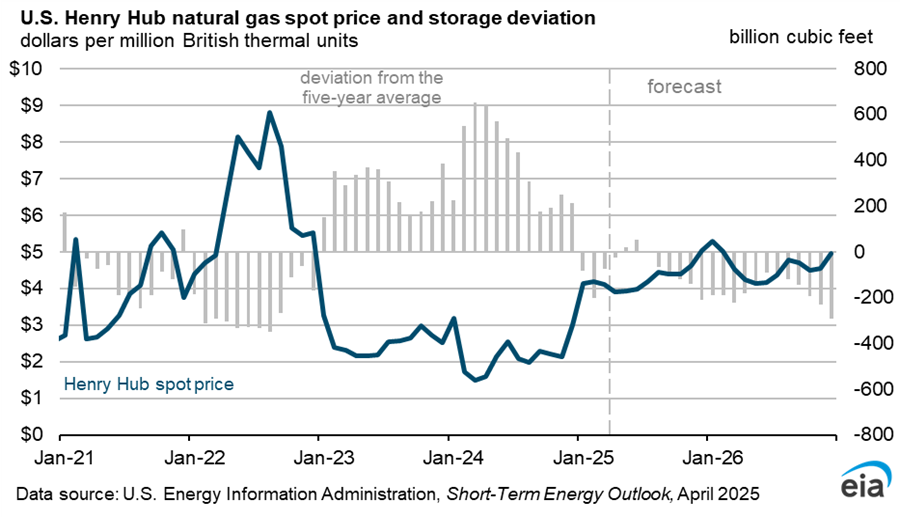
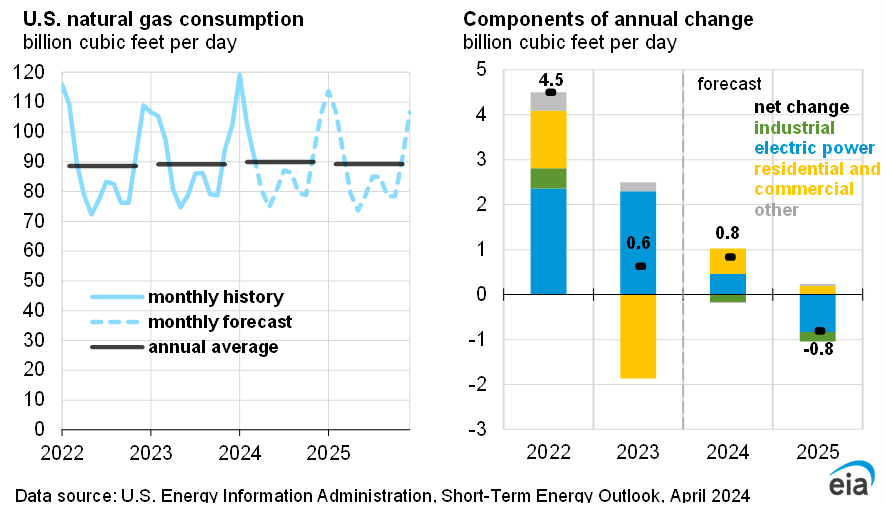
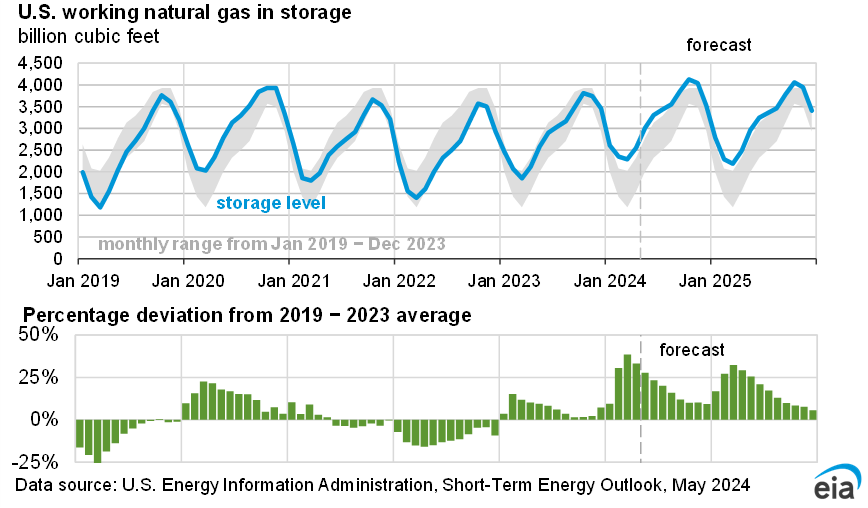
We estimate that U.S. natural gas storage inventories were 39% higher at the end of the withdrawal season (November–March) than the five-year (2019–2023) average. The United States started the winter heating season with a 5% surplus to the five-year average. The surplus at the start of winter and a mild winter that resulted in below-average natural gas consumption in the residential and commercial sectors led to the large storage inventory surplus at the end of March. The large storage surplus contributed to low natural gas prices throughout the first quarter of 2024 (1Q24). Natural gas prices at the U.S. benchmark Henry Hub averaged less than $2.00 per million British thermal units (MMBtu) in both February and March. We forecast the Henry Hub price to average less than $2.00/MMBtu in 2Q24 and about $2.20/MMBtu for all of 2024.
From April through October this year, we forecast less natural gas will be injected into storage than is typical, largely because we expect the United States will produce less natural gas on average in 2Q24 and 3Q24 compared with 1Q24. Despite lower production, we still expect the United States will end the injection season with 4,120 Bcf of natural gas in storage, 10% more than the five-year average and the most on record.
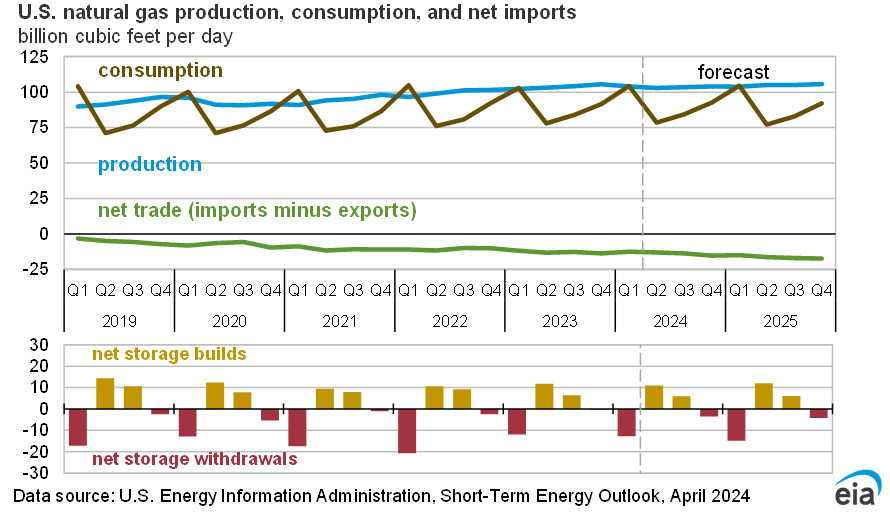
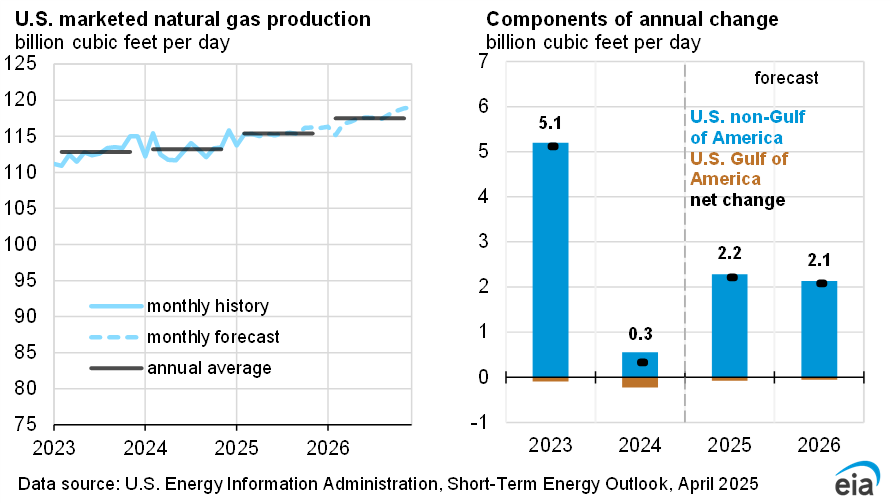
We forecast U.S. dry natural gas production to average about 103 billion cubic feet per day (Bcf/d) from April through October, down slightly from last year’s average of 104 Bcf/d for the same period. We forecast U.S. natural gas consumed for electricity generation to average 38 Bcf/d from April through October, about the same as during the same period last year. If dry natural gas production declines substantially more than we forecast or natural gas consumed for electricity generation increases more than we forecast due to hotter summer temperatures, then inventories could fall below our forecast, potentially resulting in higher prices.
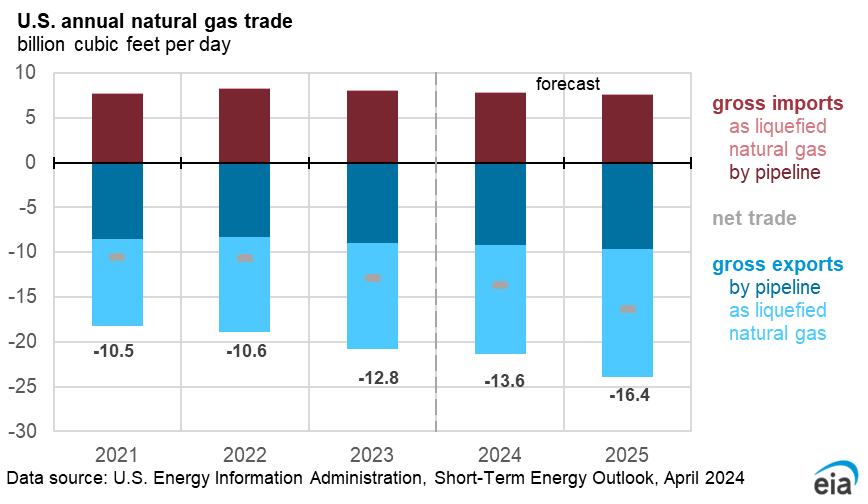
Natural gas trade
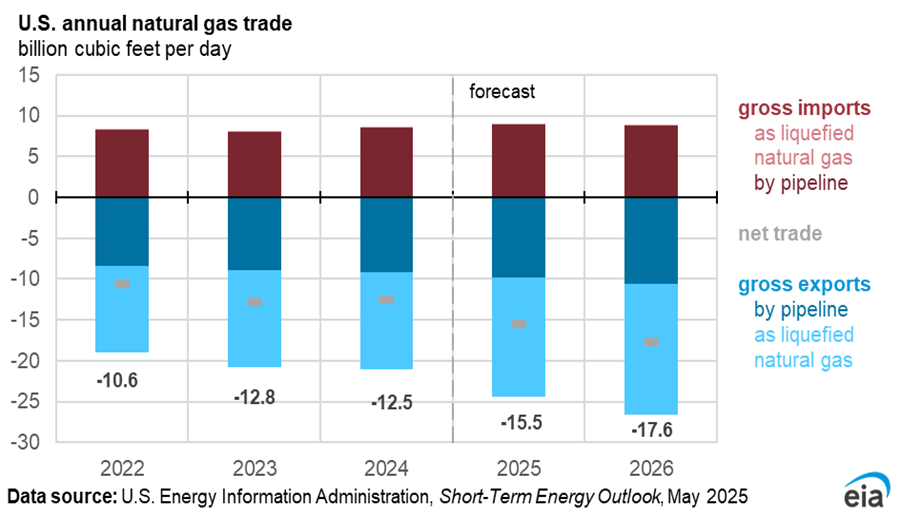
We expect U.S. liquefied natural gas (LNG) exports to average 12 Bcf/d in 2024, a 2% increase compared with last year. In 2025, LNG exports increase by an additional 2 Bcf/d (18%) because three of the five LNG export projects currently under construction are expected to start operations and ramp up to full production.
We forecast that U.S. LNG export facilities will run at similar utilization rates as in 2023, adjusted for seasonality and annual maintenance on liquefaction trains. In April and May 2024, we expect LNG exports to decline compared with April and May 2023 because two of the three trains at the Freeport LNG export facility are undergoing annual maintenance, coinciding with lower global LNG demand in importing countries during the shoulder season. Later in 2024, we expect Plaquemines LNG Phase I and Corpus Christi Stage 3 to begin LNG production and load first cargoes by the end of the year. In 2025, the developers of the Golden Pass LNG plan to place the first two trains of this new three-train LNG export facility in service.
We expect U.S. natural gas exports by pipeline to grow by almost 1 Bcf/d over the forecast period, mainly because of increased natural gas exports to Mexico. We expect several pipelines in Mexico—Tula-Villa de Reyes, Tuxpan‒Tula, and Cuxtal Phase II connecting to the Energía Mayakan pipeline on the Yucatán Peninsula—to reach full service in 2024‒25. These pipelines started partial service in 2022–23 but are not yet fully operational. In addition, flows via the Sur de Texas-Tuxpan underwater pipeline are likely to increase slightly in 2024, delivering natural gas from the United States to Mexico’s first LNG export project: Fast LNG Altamira.