Alternative Renewables Cost Assumptions in AEO2020
Release Date: 1/29/2020 | Full report

Background
The share of U.S. electricity generation from renewable sources has been increasing in recent years, from 10% of total electricity generation in 2010 to 18% in 2018, which is partially the result of rapid cost declines. Assumptions about the cost of renewable generating technologies affect the Annual Energy Outlook 2020 (AEO2020) projections, particularly in later years of the projection period when the projected trends in renewable generation are increasingly influenced by economic rather than policy factors. However, determining future, or even current, technology costs can be challenging. Capital costs for many technologies have declined in recent decades, but both the degree and the pace of future cost declines continue to be uncertain.
In the National Energy Modeling System (NEMS), EIA assumes that the capital costs for each generating technology decline annually through the projection period as a result of
- Experience-based cost reductions through factors such as learning-by-doing and manufacturing scale
- Exogenous factors such as government-funded research and development (R&D)
- Macroeconomic factors such as changes in the cost of fundamental construction material commodities[1]
The U.S. Energy Information Administration’s (EIA) AEO2020 Reference case assumes current laws and policies will remain in place, and experience-based cost reductions will occur. EIA designed the alternative renewables cost assumptions cases to examine the effect of changes to technological experience-based factors on overnight capital costs for renewables technologies that, in turn, determine relative economic competitiveness among generating technologies, including those used in distributed generation.
In the High Renewables Cost case, EIA holds the overnight capital cost constant at the 2019 level throughout the projection period for all renewable technologies, including conventional hydropower in the electric power sector and small wind and solar technologies in the end-use sectors. Fixed operating and maintenance (O&M) costs for all renewable technologies remain constant through the projection period. Fixed O&M costs are also constant in the Reference case.
EIA assumes that the overnight capital costs, O&M, and fuel prices in the Low Renewables Cost case decline more rapidly than in the Reference case. The costs are assumed to be about 40% lower than in the Reference case by 2050 for all renewable technologies. Similarly, solar photovoltaic (PV) and small wind equipment, installation, and fixed O&M costs in the end-use sectors are 40% lower than those in the Reference case by 2050.
In both Renewables Cost cases, all other assumptions within NEMS are the same as those in the Reference case.
The results of the alternative cost cases demonstrate that changing cost trajectories over time affects the overall electricity generation mix. The High Renewables Cost case results in renewable power generating technologies being less competitive relative to fossil fuel and nuclear generating technologies. The Low Renewables Cost case suggests increased penetration of renewables. Although fossil fuel generation continues to have a relatively large share of the U.S. generation mix in the Low Reneables Cost case, energy storage installations increase to accommodate the increased renewables penetration and to maintain the capacity reserve margin for grid reliability.
The cases examined are primarily intended to identify uncertainties in the cost inputs and to quantify the sensitivity of the model outputs to these inputs. The assumptions EIA used in the alternative cost scenarios are not EIA views regarding how laws or regulations should, or are likely to, change to achieve the assumed cost trajectories, but are intended to provide variations in assumptions to illustrate uncertainties.
Methodology
Table 1 summarizes the changes to the Reference case overnight capital cost and fixed O&M cost assumptions, respectively, for the alternative renewables cost scenarios. Renewables technologies in the electric power sector include conventional hydroelectric,[2] geothermal,[2] municipal solid waste (biogenic), biomass, solar thermal, solar photovoltaic (PV), offshore wind, and onshore wind. For the end-use sectors, distributed solar PV and wind are affected.
| Technology | Reference (2019) | Reference (2050) | High Renewables Cost (2050) | Low Renewables Cost (2050) |
|---|---|---|---|---|
| Overnight capital cost (2019 dollars per kilowatt) | ||||
| Biomass | 4,104 | 2,691 | 4,104 | 1,650 |
| Municipal solid waste | 1,557 | 1,085 | 1,557 | 664 |
| Onshore wind | 1,260 | 878 | 1,260 | 538 |
| Offshore wind | 5,446 | 2,369 | 5,446 | 1,411 |
| Solar thermal | 7,191 | 4,364 | 7,191 | 2,716 |
| Solar photovoltaic, utility-scale | 1,307 | 615 | 1,307 | 374 |
| Solar photovoltaic, residential[2] | 2,019 | 1,382 | 2,019 | 829 |
| Solar photovoltaic, commercial[2] | 1,539 | 993 | 1,539 | 596 |
| Wind, residential | 5,200 | 5,200 | 5,200 | 3,120 |
| Wind, commercial | 1,548 | 1,548 | 1,548 | 929 |
| Fixed operation and maintenance cost (2019 dollars per kilowatt per year) | ||||
| Biomass | 125.2 | 125.2 | 125.2 | 75.11 |
| Municipal solid waste | 20.02 | 20.02 | 20.02 | 12.01 |
| Onshore wind | 26.22 | 26.22 | 26.22 | 15.73 |
| Offshore wind | 109.5 | 109.5 | 109.5 | 55.54 |
| Solar thermal | 85.03 | 85.03 | 85.03 | 51.02 |
| Solar photovoltaic, utility-scale | 15.19 | 15.19 | 15.19 | 9.111 |
| Solar photovoltaic, residentialb | 18 | 12 | 18 | 7 |
| Solar photovoltaic, commercial2 | 16 | 10 | 16 | 6 |
| Wind, residential | 31 | 31 | 32 | 19 |
| Wind, commercial | 230 | 227 | 230 | 133 |
| a. For hydropower and geothermal resources, costs are based on site-specific supply curves. b. Costs are expressed in dollars per kilowatt of direct current (DC) instead of net alternating current (AC) power available to the grid. Source: U.S. Energy Information Administration, Annual Energy Outlook 2020 |
||||
Results
Electricity Generation
In the High Renewables Cost case, total generation from the electric power sector remains largely unchanged relative to the Reference case, and total self-generation from the residential and commercial sectors—which accounts for less than 10% of total generation in 2050—decreases 6% from the Reference case in 2050. Because of the increase in self-generation by the end-use sectors in the Low Renewables Cost case, total generation from the electric power sector in the Low Renewables Cost case is slightly lower than in the Reference case
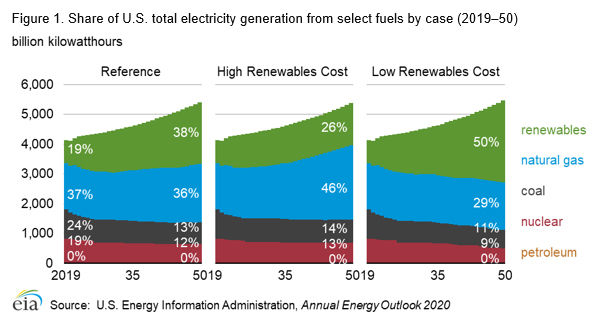
Although total net generation from all sectors across the cases remains relatively unchanged, the generation mix differs across the cases (Figure 1). In the Reference case, electricity generation from natural gas maintains a relatively constant share, about 36%–38% of total generation, through the projection period. The share of renewable generation, on the other hand, increases from 19% of total generation in 2019 to 38% by 2050. In the High Renewables Cost case, electricity generation from renewable sources grows at a slower pace than in the Reference case, contributing 26% of total generation by 2050. In this case, natural gas-fired generation is a direct replacement for renewables relative to Reference case levels (natural gas-fired generation increases to 46% of total generation by 2050), while less nuclear capacity retires. In the Low Renewables Cost case, the share of renewable generation increases to 50% of total generation by 2050. Generation from coal, natural gas, and nuclear all decline relative to Reference case levels, and natural gas accounts for only 29% of total generation in 2050.
The increase in renewables generation in the Reference case comes mostly from the increase in solar PV in the electric power sector, which grows more than tenfold from 69 billion kilowatthours (BkWh) in 2019 to 760 BkWh in 2050 (Figure 2). Solar PV in the end-use sectors increases more than fourfold (from 41 BkWh to 182 BkWh) during the same period. Solar PV generation is less affected by cost from the end-use sectors than from the power sector, especially in the residential sector where solar PV adoption is affected by income and social factors. Utility-scale solar PV, on the other hand, is more sensitive to the changes in the cost assumptions. Because solar PV generates during the daytime, it competes directly with natural gas-fired peaking plants. In the Low Renewables Cost case, utility-scale solar PV is more competitive compared with natural gas-fired generation capacity to meet growing demand. When solar PV is no longer economically competitive, as in the High Renewables Cost case, natural gas-fired generation capacity replaces it as the more cost-competitive generating technology to meet demand. Wind plants generate mostly at night or during the fall and spring when the demand for electricity is typically low; therefore, onshore wind is less effected by the changes in the cost assumptions than solar PV.
In the High Renewable Cost case, which assumes constant installed costs, generation from wind is slightly less in 2050 than in the Reference case. In the Low Renewables Cost case, wind generation increases at a more rapid pace after 2035. While the PTC is phasing-out, through 2023, wind is highly cost-competitive. Wind projects are accelerated in the near term to take advantage of tax credits before they expire. Once expired, the most economically attractive projects absent the tax credit have already been built, at least until electricity demand and economic conditions create new opportunities after 2035.
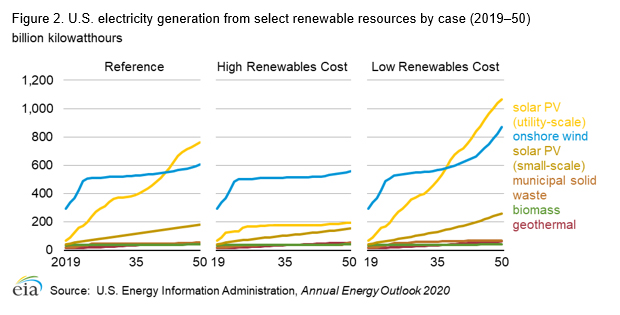
The accelerated learning-induced cost decline in the Low Renewables Cost case is not significant enough to make either offshore wind or solar thermal technologies substantially more economically competitive than in the Reference case.
Electricity Prices
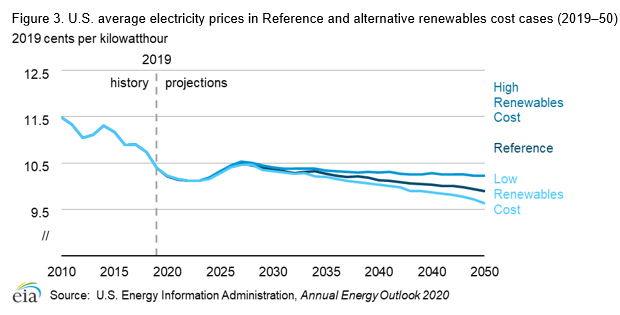
EIA projects that in all cases, U.S. average electricity prices across all end-use sectors will continue declining through 2022 and increase slightly until 2027 because of higher expected natural gas prices (Figure 3). In the long term, projected electricity prices will decline between 2027 and 2050 as a result of the relatively flat natural gas prices and falling generation costs from the increasing penetration of renewables. The average electricity prices in all cases remain in a relatively tight range between 10.1 cents/kWh and 10.5 cents/kWh (2019 dollars) through the early 2030s. The prices in the alternative cases diverge from the Reference case around the mid-2030s, ending 3% higher in the High Renewables Cost case and 3% lower in the Low Renewables Cost case by 2050 than in the Reference case.
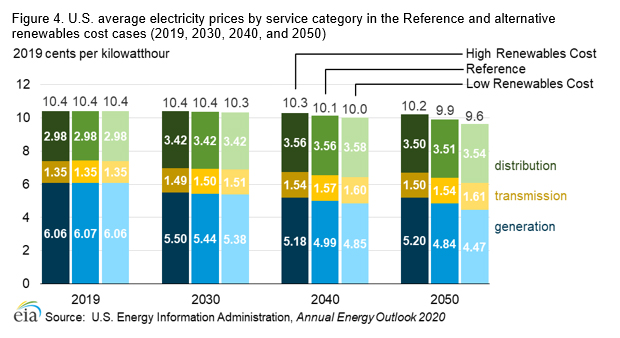
With the higher cost to build renewable capacity—particularly solar PV—in the High Renewables Cost case, more electricity is generated from natural gas. Because some zero-fuel-cost solar PV generation is replaced by higher-fuel-cost natural gas generation, electricity prices are higher in the High Renewables Cost case, as reflected in the higher generation components of prices shown in Figure 4. In contrast, because more renewables capacity is added in the Low Renewables Cost case, electric power sector fuel expenditures decline and investment costs are reduced with the lower capital costs for renewables, leading to lower electricity prices.
In addition to the generation cost component, electricity prices also consist of transmission and distribution cost components that are functions of peak demand and overall customer sales. Furthermore, the transmission cost component is also influenced by grid interconnection costs that are incurred from interconnecting new electric generating capacity. In the Low Renewables Cost case, the transmission cost component is highest compared with the Reference and the High Renewables Cost cases. Because renewable generating technologies—mainly solar PV and wind—have lower capacity factors than fossil and nuclear technologies, more intermittent capacity is needed to replace generation that would otherwise be available from baseload generating technologies. Fewer capacity additions are needed to meet the projected demand in the High Renewables Cost case because of higher levels of natural gas and nuclear generation, so the transmission cost component is lower than for the other cases. The distribution cost component is also highest in the Low Renewables Cost case because the costs are recovered over fewer retail sales as a result of increased self-generation in the end-use sectors.
Carbon Dioxide (CO2) Emissions
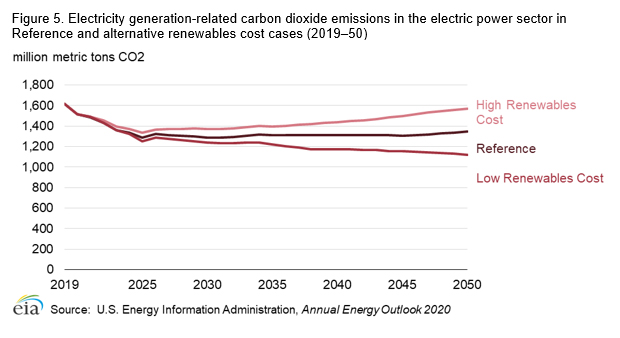
EIA expects electricity-related CO2 emissions to decline in all three cases in the near term because of increased coal-fired power plant retirements (Figure 5). In the long term, electricity-related CO2 emissions stay relatively flat in the Reference case through the projection period as gradual declines in coal-fired generation is mostly offset by the increase in natural gas-fired generation, a result of continued low natural gas prices. Increased penetration of renewables in the Low Renewables Cost case (including end-use solar PV that, in turn, reduces demand for purchased electricity) further reduces electricity generation-related CO2 emissions relative to the Reference case through 2050. In the Reference case, electricity-related CO2 emissions decrease from 1,616 million metric tons in 2019 to 1,346 million metric tons in 2050. Electricity-related CO2 emissions in 2050 are 229 million metric tons (17%) lower in the Low Renewables Cost case compared with the Reference case. CO2 emissions in the High Renewables Cost case are higher for most of the projection years because less renewables capacity is available for electricity generation. In 2050, electricity-related emissions in the High Renewables Cost case are 223 million metric tons (17%) higher than in the Reference case.
Footnotes
- U.S. Energy Information Administration, Assumptions to the Annual Energy Outlook 2019: Electricity Market Module, pages 7–10.
- For conventional hydroelectric and geothermal resources, costs are based on site-specific supply curves and are not summarized in Table 1.