Alternative Policies in Power Generation and Energy Demand Markets
Release Date: 5/14/18

This article presents results from two sets of alternative scenarios related to the U.S. Energy Information Administration’s (EIA) Annual Energy Outlook 2018 (AEO2018) to analyze potential outcomes from varying policies affecting the U.S. energy system in the areas of renewable electric generation and end-use efficiency. The first set of cases looks at renewable tax credits and examines the impacts of tariffs on imported solar photovoltaic (PV) cells and modules. A short discussion of the AEO2018 Clean Power Plan (CPP) [1] case summarizing potential effects of hypothetical CPP implementation on U.S. electricity markets is also included. The second set of cases examines changes to end-use efficiency policies, including joint Corporate Average Fuel Economy (CAFE) and Greenhouse Gas (GHG) Emissions standards for light-duty vehicles (LDVs) and efficiency standards for residential and commercial equipment.
The cases examined here are primarily intended to identify and quantify uncertainties in energy system inputs associated with potential future changes in the legislative environment. This article is not intended to cover the full range of policy options available to energy policymakers. Furthermore, the policy assumptions used in the alternative cases should not be construed as EIA opinion regarding how laws or regulations should, or are likely to, be changed.
Background
The AEO2018 Reference case is best described as a current laws and regulations case, because it generally assumes that existing laws and regulations remain unchanged throughout the projection period. Exceptions to this guiding principle include those current laws or regulations that include sunset dates or specific changes over time. The Reference case serves as a starting point for analysis of possible changes in legislation or regulations. The alternative cases in this article assume changes to laws and regulations that have a history of being extended beyond their legislated sunset dates or that call for periodic updates beyond current standard levels. Distinct scenarios are presented for each topic area to simplify comparison with Reference case projections and with other scenarios that focus on the same topic.
Table 1 provides case names and summary descriptions of changes to Reference case assumptions for the alternative policy scenarios. The methodology section provides a more complete description of alternative assumptions.
| Section | Case name | Description |
|---|---|---|
| Renewable and electricity policy cases | Production tax credit and/or investment tax credit extension (PTC/ITC extension) | Extends PTC and ITC through 2050 at full value (no phaseout) |
| Early PTC/ITC sunset | Eliminates PTC and ITC in 2019 | |
| Solar PV tariff | Imposes a declining four-year tariff on PV imports for PV systems installed 2019–22 | |
| End-use efficiency policy cases | New efficiency requirements | Includes additional updates to federal efficiency standards for residential and commercial major end-use equipment and increases LDV fuel economy and emissions standards beyond 2025 in the transportation sector |
| No new efficiency requirements | Removes residential and commercial federal efficiency standards slated to go into effect after 2018 for major end-use equipment and maintains LDV fuel economy and emissions standards at 2021 levels in the transportation sector | |
The results of the renewable and electricity policy cases demonstrate that changing the duration of renewable tax credits affects the evolution of the generation resource mix over time more than it affects overall electricity demand. The Solar PV Tariff case results in a lesser effect on electricity generation than in the tax credit cases, as the increase in solar system costs from the tariff is projected to moderate by 2025. The two end-use efficiency policy cases show changes in total delivered energy consumption relative to the AEO2018 Reference case that are similar in magnitude but opposite in direction. However, sector-level results differ between the cases. Changes in building sector efficiency standards affect buildings energy consumption more in the New Efficiency Requirements case than in the No New Efficiency Requirements case, while transportation energy consumption is affected more in the No New Efficiency Requirements case than in the New Efficiency Requirements case.
Methodology
The scenarios presented in this article start with the AEO2018 Reference case but change particular assumptions to address uncertainty about the future of selected existing laws and regulations. Each scenario focuses on a single policy topic, changing assumptions for each policy in a specific direction. This approach simplifies comparison with the Reference case and with other scenarios that focus on the same or similar topics. An advantage to this approach is that it separates effects that may be offset if alternative policies targeting energy supply and energy consumption are combined in one scenario. A single set of end-use efficiency policy cases is sufficient because policies targeting LDVs are primarily responsible for changes in liquids consumption and policies targeting efficiency in buildings are primarily responsible for changes in electricity and natural gas relative to the Reference case.
Renewable and electricity policy case descriptions
The renewable and electricity policy scenarios focus on potential changes to the costs of renewable technologies in terms of renewable tax credits and import tariffs. This section includes a case description for each scenario that details changes from Reference case assumptions. A brief description of the AEO2018 CPP case is also included.
PTC/ITC Extension case
This case assumes that existing tax credits that have scheduled reductions and sunset dates remain at their full credit values through 2050. In particular, the PTC/ITC Extension case adopts the following assumptions:
- The Production Tax Credit (PTC) for eligible utility-scale electricity generating technologies retains its full credit value through 2050 as opposed to declining in value starting in 2017 (wind) or expiring at the end of 2016 [2] (other PTC-eligible technologies, including geothermal and hydroelectric) as specified in the Reference case. The PTC provides a credit of $24 per megawatthour ($/MWh in 2017 dollars) for qualifying electricity production from wind, closed-loop biomass, geothermal, and certain waste energy facilities. The PTC also provides a half-value credit of $12/MWh for qualifying electricity production from open-loop biomass, incremental hydroelectric, marine, tidal, and certain other waste energy facilities.
- For solar power, the full Investment Tax Credit (ITC) value of 30% remains in effect through 2050 for the residential, commercial, and electric power sectors. In the Reference case, the value of the ITC begins to decline in 2020, achieving a permanent 10% level for commercial and electric power sectors and phasing out completely for the residential sector by 2022. In addition, EIA assumes offshore wind projects that are eligible to claim the ITC in lieu of the PTC will opt for the ITC due to their high capital costs.
- In the building sectors, the ITC for solar water heaters is assumed to remain at 30% rather than being phased out in 2022 (residential systems) or declining to 10% (commercial systems).
Early PTC/ITC Sunset case
This case assumes existing tax credits expire completely in 2019, before their currently scheduled phaseouts and expirations as represented in the Reference case. Specifically, the Early PTC/ITC Sunset case includes the following assumptions:
- All renewable generation tax credits expire in 2019, including a complete sunset of the ITC for solar PV in the residential, commercial, and electric power sectors, other ITC-eligible technologies in the power sector, and the PTC for wind and other PTC-eligible technologies.
- The available ITC for solar water heaters in both the residential and commercial sectors is also assumed to sunset in 2019.
Solar PV Tariff case
This case assumes implementation of a declining-value tariff on imported solar modules. On January 22, 2018, the President approved a tariff of 30% on crystalline silicon (c-Si) solar PV cells and modules that are imported into the United States. The tariff is scheduled to start in 2018 and remain in effect for four years, declining by 5 percentage points annually and expiring completely after 2021. The first 2.5 gigawatts (GW) of imported solar PV cells are exempt from the tariff in each of the four years.
EIA estimates that the initial 30% tariff on the module component of PV systems will increase the system cost of utility PV systems by 10%. This cost increase is reflected in this case for systems entering service in 2019. The prorated cost increase is reduced to 8.3%, 6.7%, and 5.0% for utility-scale solar PV projects entering service in 2020, 2021, and 2022, respectively. Prorated cost increases for residential solar PV equate to 4.0%, 3.1%, 2.5%, and 1.8% in 2019 through 2022, while non-residential end-use solar PV costs increase 6.0%, 4.6%, 3.7%, and 2.8% during the same time period.
Clean Power Plan case
The CPP rule, issued under Section 111(d) of the Clean Air Act (CAA), is the U.S. Environmental Protection Agency (EPA) program to regulate carbon dioxide (CO2) emissions at existing fossil fuel-fired electric power plants. The CPP rule allows states to choose either mass-based (annual limit on CO2 emissions) or rate-based (annual adjusted emission rate in pounds of CO2/MWh) emissions targets. The rule also provides flexibility in other areas, such as regional cooperation through trading. AEO2018 includes a CPP case with detailed projections available in the AEO2018 Projections Tables for Side Cases. [3]
Even though it is not the major focus of this article, AEO2018 includes a CPP case that incorporates the following:
- Compliance starts in 2022, and reductions are phased in between 2022 and 2030 using three sets of multi-year, interim goals instead of one interim period.
- Demand-side energy efficiency was not used in setting rate-based targets, although it still may be used for compliance.
- The variations between state targets have been reduced by using source-specific rates for fossil fuel steam and natural gas-fired combined-cycle generation at the interconnection level rather than individual state emission rates.
- Compliance calculations for rate-based targets have been limited to capacity additions since 2012 rather than also including pre-existing renewable capacity and at-risk nuclear plants.
- Greater detail is provided for mass-based implementation approaches and emissions credit trading.
In February 2016, the U.S. Supreme Court issued a stay of enforcement of the existing plant rule, pending resolution of legal challenges from the states and the affected industries. EPA has subsequently initiated a process of replacing the CPP with an alternative regulatory program to address the Endangerment Finding, which requires EPA to reduce greenhouse gases covered under the CAA from power plants and other sources of air pollutant emissions. Because the combination of these two actions will largely preclude enforcement of the CPP as originally implemented, the AEO2018 Reference case does not include it among current laws and regulations. The AEO2018 CPP case presented here assumes that the CPP will proceed as currently enacted and that all states will implement it by using a mass-based standard that caps emissions from both existing and new power plants, with allowance revenues rebated to ratepayers.
End-use efficiency policy case descriptions
The end-use efficiency policy scenarios focus on potential changes to joint CAFE and GHG Emissions standards for LDVs and efficiency standards for residential and commercial equipment. The Reference case includes the joint attribute-based final and augural CAFE and final vehicle GHG emissions standards through model year (MY) 2025 for LDVs as issued in 2012. [4] In April 2018, EPA announced a reconsideration of GHG emissions standards for MY 2022 to MY 2025. [5] The scenarios below do not address any implications of this announcement. The EPA and the U.S. Department of Transportation, National Highway Traffic Safety Administration (NHTSA), will initiate a notice and comment rulemaking to further consider standards for MY 2022 to MY 2025. The Reference case includes federal efficiency standards for residential and commercial equipment for which final rules have been issued. Federal standards in the Reference case range from those that are currently in effect to those that have been finalized with compliance required at a future date. For example, the Reference case includes a standard for residential central air conditioners and heat pumps that was finalized in 2017 with compliance required on January 1, 2023.
The following case descriptions detail changes from Reference case assumptions for each efficiency policy scenario.
New Efficiency Requirements case
This case assumes that joint CAFE and GHG Emissions standards for LDVs and the efficiency standards for residential and commercial major end-use equipment are both expanded beyond current provisions. In particular, the New Efficiency Requirements case adopts the following assumptions:
- The Reference case and the New Efficiency Requirements case include the joint attribute-based CAFE and vehicle GHG emissions standards through MY 2025 for LDVs as issued in 2012. [6] In the Reference case, CAFE and GHG emissions standards are assumed to remain constant at MY 2025 levels in subsequent model years, although the fuel economy of new LDVs continues to improve modestly over time because of economic, consumer, and other factors. The New Efficiency Requirements case assumes continued increases in CAFE and GHG emissions standards at an annual average rate of 0.4% through MY 2050 for new LDVs after MY 2025.
- Standards for residential and commercial major end-use equipment are assumed to be updated according to the timeline in the U.S. Department of Energy (DOE) multiyear plan at levels based on ENERGY STAR® specifications or on Federal Energy Management Program purchasing guidelines for federal agencies, as applicable. Standards also are updated for products that currently are not subject to federal efficiency standards but are covered by voluntary industry agreements or by state standards. The equipment standards assumed for the New Efficiency Requirements case are meant to illustrate the potential effects of those policies on energy consumption for buildings. No cost-benefit analysis or evaluation of impacts on consumer welfare was completed in developing the assumptions. Likewise, no technical feasibility analysis was conducted, although standards were not allowed to exceed the maximum technologically feasible levels described in DOE’s technical support documents.
No New Efficiency Requirements case
This case assumes that joint CAFE and GHG emissions standards for LDVs and the efficiency standards for residential and commercial major end-use equipment are not tightened beyond provisions effective in MY 2021 (for LDVs) or in 2018 (for end-use equipment). In particular, the No New Efficiency Requirements case adopts the following assumptions:
- The No New Efficiency Requirements case holds the joint attribute-based CAFE and vehicle GHG emissions standards constant at MY 2021 levels through MY 2050, although the fuel economy of new LDVs continues to rise modestly over time as a result of economic, consumer, and other factors.
- Standards for residential and commercial major end-use equipment are assumed to be held constant at 2018 levels. Standards slated to go into effect after 2018 are removed from the projections.
Results
Scenario results are grouped according to the energy markets affected by the changes in policy assumptions relative to the AEO2018 Reference case. Cases that look at policies affecting renewable generation technologies are compared with the Reference case and with each other. Similarly, cases that focus on end-use efficiency policies are grouped together for comparison.
Analysis results for renewable and electricity policy cases
Although the side cases analyzed do not appreciably affect overall electricity demand, they measurably affect the evolution of the generation resource mix over time. The near-term growth of wind capacity observed in the Reference case becomes more gradual and protracted when the PTC is extended through 2050 and also when its expiration date is moved to 2019. In the long term, an extended PTC leads to more wind capacity growth, and an early expiration leads to fewer wind capacity additions.
An early ITC sunset has a greater impact on electricity generation from utility-scale solar PV than on end-use solar PV electricity generation because of differences in the structure of the incentive for PV systems owned by businesses and those owned by private individuals. Although the impact of the approved tariff on solar cells and modules is expected to affect utility-scale solar PV more than end-use solar PV, the effect of the increase in final system cost is expected to moderate by 2025.
Electricity generation
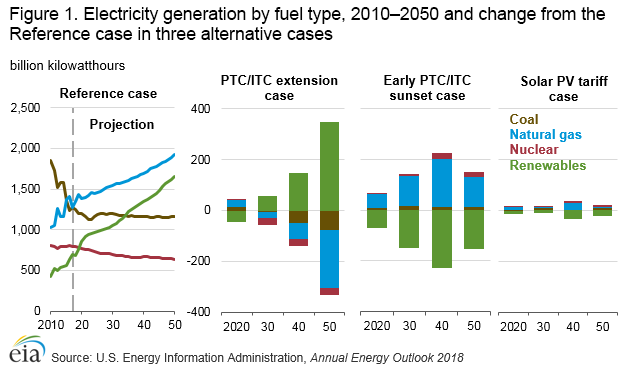
The total electricity generation from all fuel sources is similar across the cases as fuels replace one another in the generation mix. The share of each fuel type changes only slightly in most cases: 20%–22% for coal, 11%–12% for nuclear, 31%–38% for natural gas, [7] and 28%–37% for renewables. While the trade-off between natural gas and renewables electricity generation is observed across all cases, it is most evident in the PTC/ITC Extension case, where the share of electricity generation from natural gas declines to 31% and the share of electricity generation from renewables increases to 37% as additional renewable capacity is installed through 2050 (Figure 1).
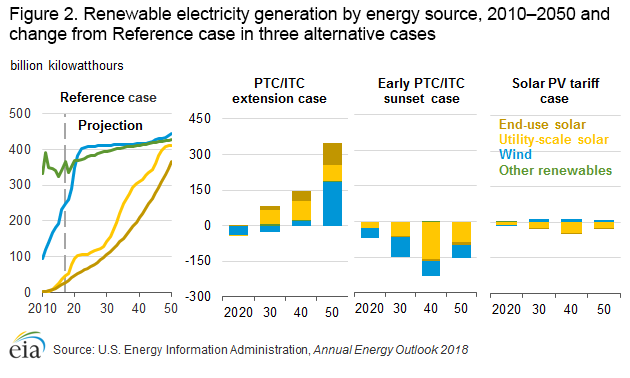
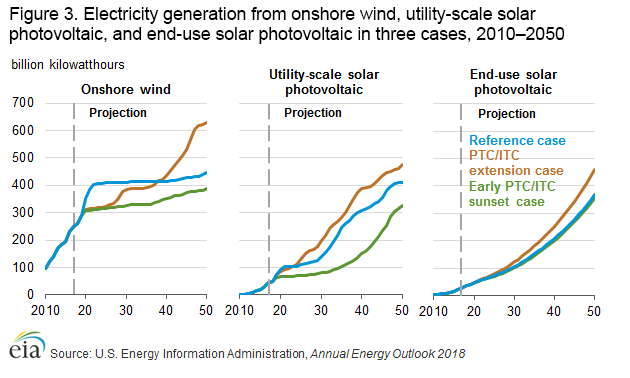
In the near term in the PTC/ITC Extension case, the share of electricity generation from wind resources is smaller than in the Reference case (Figure 2). In the Reference case, wind projects are accelerated to take advantage of tax credits before they expire. In the PTC/ITC Extension case, wind additions are built later in the projection period when electricity demand and economic conditions are more favorable. By 2050, electricity generation from wind accounts for 12% (630 billion kilowatthours (kWh)) of total electricity generation, compared with 8% (445 billion kWh) in the Reference case. Between 2017 and 2050, electricity generation from both utility-scale and end-use solar PV in the PTC/ITC Extension case increases more than in the Reference case; however, the increase is smaller than the increase from wind (Figure 3). This difference suggests that even though utility-scale and end-use solar PV are expected to become more cost competitive over the projection period, wind capacity with the tax credit is seen to be the more competitive project.
Although tax credits for residential projects expire in the Reference case and those for commercial projects decline to 10% starting in 2022, the solar ITC continues at the full value of 30% through 2050 in the PTC/ITC Extension case for all sectors. Electricity generation from end-use solar PV grows faster in the PTC/ITC Extension case than in the Reference case by an average of 9%/year from 2017 to 2050 compared with 8%/year in the Reference case. Utility-scale solar PV generation shows a larger response in the near-term and mid-term because of higher capacity additions in response to the tax credit extension. The effects of tax credit extensions on other eligible renewable generation technologies, including hydropower, biomass, and geothermal, are minimal in comparison.
Allowing the PTC and the ITC to expire in 2019—as in the Early PTC/ITC Sunset case—has a larger effect on utility-scale solar projects than on other renewable technologies compared with the Reference case. In 2050, electricity generation from utility-scale solar is 83 billion kWh (20%) less compared with a 57 billion kWh (13%) decrease in wind relative to the Reference case. Electricity generation from utility-scale solar in the Early PTC/ITC Sunset case differs more markedly in the early years as a result of the tax credit expiration. In the Reference case, the utility-scale solar PV market experiences slow growth between 2020 and 2030, but sees builds increase at a faster pace between 2030 and 2040, contributing to higher electricity generation. In the absence of the permanent 10% ITC, utility-scale solar PV builds are fewer and much more gradual. As the market adjusts after 2035, rapid installation of utility-scale solar PV systems narrows the gap in electricity generation by 2050, reaching 326 billion kWh in the Early PTC/ITC Sunset case compared with 409 billion kWh in the Reference case.
Electricity generation from end-use solar PV in the Early PTC/ITC Sunset case experiences little change, however, from the Reference case on the whole—4% less per year on average—because the ITC for residential solar PV systems is already scheduled to expire in 2022 in the Reference case. While solar PV generation in the commercial sector experiences a larger percentage reduction (7% less per year on average) compared with the residential sector (3% less per year on average), the commercial sector composes a smaller share of the end-use solar PV market.
Although electricity generation from wind is more than 20% lower in the Early PTC/ITC Sunset case than in the Reference case from 2022 through 2036, the market for new wind builds does not disappear completely with the immediate elimination of the tax credit. Instead, new wind capacity is added more gradually over time, rather than in the front-loaded growth pattern seen in the Reference case in anticipation of the tax credit phaseout. In the Reference case, electricity generation from wind increases 78% between 2017 and 2050 (approximately 2%/year), with most of the growth occurring before 2022. In the Early PTC/ITC Sunset case, wind generation increases 56% (approximately 1%/year) with growth much more evenly spread through the projection period. This change is consistent with the finding in the PTC/ITC Extension case—the phaseout of the tax credit results in some wind projects being built earlier than market conditions would otherwise dictate so that producers can claim the credit.
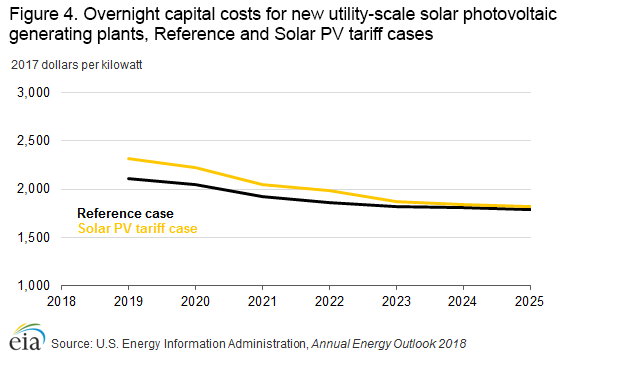
The smallest difference in electricity generation compared with the Reference case is in the Solar PV Tariff case. The effect of the increase in overnight capital cost from the tariff on solar cells and modules is evident from 2019 through 2022, but it is projected to moderate by 2025 (Figure 4).
The tariffs on solar PV are expected to have a larger effect on electricity generation from utility-scale solar than end-use solar systems, because the tariff is expected to have a larger impact on the final system cost for utility-scale solar installations. Although the Solar PV Tariff case results in fewer new solar PV builds than in the Reference case, onshore wind projects are projected to increase to help fill the market gap resulting from the reduced solar installations. Between 2019 and 2050, annual wind generation is expected to be 3% higher on average in the Solar PV Tariff case compared with the Reference case.
Compared with the AEO2018 Reference case, the CPP case results in 24% less electricity generated from coal and slightly more generation from natural gas (4%) and nuclear (1%) by 2050. Electricity generation from renewables is also 3% higher in the CPP case, and a 7% increase in installations of diurnal storage by 2050 is expected to serve a portion of electricity demand. In contrast to AEO2017, the level of electricity generation from utility-scale solar PV in the CPP case is similar to that in the Reference case. Because the utility-scale solar PV competitiveness is expected to increase during the projection period, the market impacts of the CPP are expected to be less important to its overall competitive position relative to AEO2017 assumptions.
Energy prices, tax credit payments, and other market impacts
All-sector average electricity prices in the Reference case and Renewable and Electricity Policy cases remain in a relatively tight range between 10.6 cents/kWh and 11.3 cents/kWh (2017 dollars) through 2050 (Figure 5). Electricity prices in the near term are slightly higher in the PTC/ITC Extension case than in the Reference case. With the certainty of continued tax credits in the PTC/ITC Extension case, renewable capacity—particularly wind—is added later than in the Reference case, resulting in more electricity generation from natural gas, which increases fuel costs and electricity prices. As more renewable capacity is added later in the projection period of the PTC/ITC Extension case, electric power sector fuel costs decline, leading to lower electricity prices. Electricity prices in the Early PTC/ITC Sunset case are also slightly higher in the near term than in the Reference case. Higher prices extend longer into the projection period before renewable generating capacity becomes more cost competitive in the market.
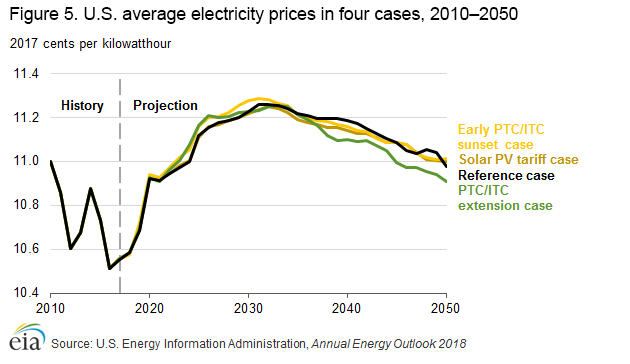
In all cases, U.S. average electricity prices are projected to increase through the early 2030s as a result of rising natural gas consumption and prices and increases in the transmission and distribution cost components. The average electricity price across all sectors begins to decline thereafter, however, as the generation cost component—which represents the largest share of the price of electricity—decreases in response to increased generation from renewables.
The reductions in delivered energy consumption and CO2 emissions in the PTC/ITC Extension case are accompanied by higher equipment costs for consumers and increased tax expenditures that reduce net tax revenue for the U.S. government (Table 2). The additional investments by consumers in the PTC/ITC Extension case are offset, however, by savings on electricity purchases as a result of increases in distributed generation. Compared with the Reference case, consumers in the residential and commercial sectors save an average $3.2 billion (2017 dollars) in annual electricity costs from 2017 to 2050 in the PTC/ITC Extension case.
| Average annual expenditure (billion 2017 dollars per year) | Reference | PTC/ITC Extension | Early PTC/ITC sunset | Solar PV tariff |
|---|---|---|---|---|
| Consumer capital costs for solar equipment | $15.1 | $18.9 | $14.6 | $15.0 |
| % change from Reference | - | 24.6% | -3.5% | -0.7% |
| Government tax expenditures for consumer solar equipment | $0.9 | $5.7 | $0.3 | $0.9 |
| % change from Reference | - | 539.5% | -63.4% | -0.7% |
| Consumer electricity purchases | $361.3 | $358.1 | $362.3 | $361.2 |
| % change from Reference | - | -0.9% | 0.3% | 0.0% |
In the Early PTC/ITC Sunset case, residential and commercial consumers spend $0.5 billion/year (2017 dollars) less on average on solar equipment from 2017 to 2050 than in the Reference case, and the government’s tax expenditures decrease by $0.6 billion/year. Total electricity purchases increase by $0.9 billion/year in the Early PTC/ITC Sunset case.
In the electric power sector, the extension of the PTC in the PTC/ITC Extension case increases government tax expenditures between 2017 and 2050 by an additional $1.6 billion/year from an average of $1.1 billion/year in the Reference case, mostly contributed by wind. Similarly, the extension of the ITC increases government tax expenditures in the electric power sector by an additional $1.3 billion/year during 2017–50 in the PTC/ITC Extension case from an average of $1.0 billion/year in the Reference case, primarily as a result of additional credits for utility-scale PV. By contrast, government tax expenditures decrease in the Early PTC/ITC Sunset case as a result of expiration of the available PTC and ITC in 2019. Compared with the Reference case, tax expenditures for the PTC decrease by an average $0.8 billion/year, and tax expenditures for the ITC decrease by an average of $0.8 billion/year in the Early PTC/ITC Sunset case.
For all sectors combined, government tax expenditures for renewable tax credits in the PTC/ITC Extension case average $10.6 billion/year over 2017–50, or more than three times the average of $3.0 billion/year in the Reference case. By contrast, government tax expenditures decrease in the Early PTC/ITC Sunset case to an average of $0.8 billion/year with the expiration of available PTC and ITC credits.
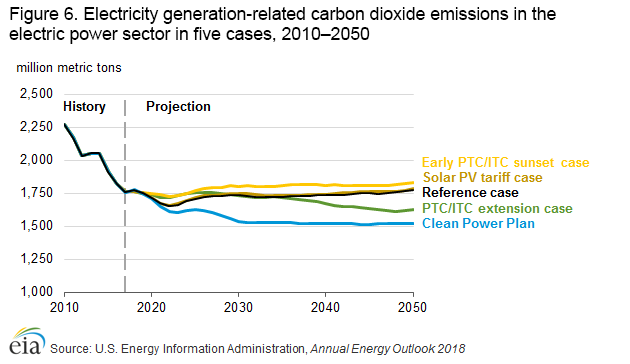
Electricity-related CO2 emissions are expected to decline in all cases in the near term as a cumulative effect of increased coal plant retirements, higher natural gas-fired generation because of lower natural gas prices, and stable electricity demand. Increased penetration of end-use solar PV in the PTC/ITC Extension case further reduces overall demand for purchased electricity, resulting in lower electricity-related CO2 emissions than in the other cases (Figure 6). In the Reference case, electricity-related CO2 emissions are projected to increase from 1,760 billion metric tons in 2017 to 1,777 billion metric tons in 2050. Electricity-related CO2 emissions in 2050 are 148 billion metric tons (8%) lower in the PTC/ITC Extension case compared with the Reference case. CO2 emissions in the Early PTC/ITC Sunset case are generally highest among the cases for most of the projection years because less renewables capacity is available for electricity generation. In 2050, electricity-related emissions in the Early PTC/ITC Sunset case are 51 billion metric tons (3%) higher than in the Reference case.
Analysis results for end-use efficiency policy cases
In general, estimates for overall delivered energy consumption are lower in the New Efficiency Requirements case and higher in the No New Efficiency Requirements case than in the Reference case. Efficiency policies targeting LDVs are primarily responsible for changes in liquids consumption, and policies targeting efficiency in buildings are primarily responsible for changes in electricity and natural gas consumption relative to the AEO2018 Reference case. All scenarios use Reference case assumptions for the industrial sector; any changes in industrial energy consumption are because of changes in energy prices relative to the Reference case.
Energy consumption
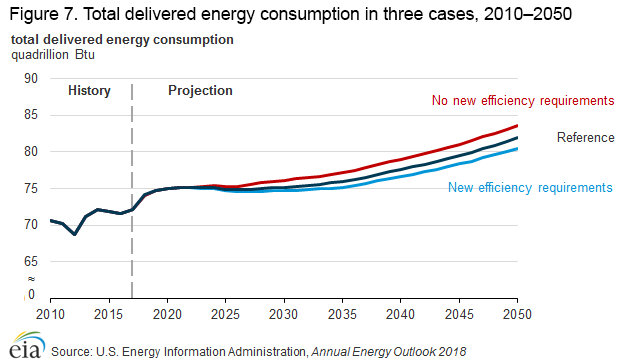
Total delivered energy consumption in the New Efficiency Requirements case is lower than in the AEO2018 Reference case throughout the projection period as a result of improvements in energy efficiency (Figure 7). In 2050, delivered energy consumption in the New Efficiency Requirements case is 2% lower than in the Reference case, as the combination of the buildings and transportation policies reduces overall demand. Total delivered energy consumption in the No New Efficiency Requirements case is higher than in the Reference case in 2019 and from 2022 through 2050, and it is 2% higher than in the Reference case in 2050 as less-efficient choices remain in the market. The cumulative difference in delivered energy consumption from 2017 to 2050 is 54 quadrillion British thermal units (Btu) between the New Efficiency Requirements case and the No New Efficiency Requirements case.
Buildings sector energy consumption
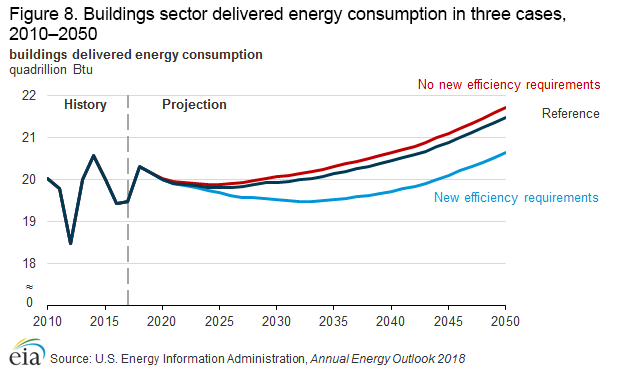
In the New Efficiency Requirements case, delivered energy consumption in the buildings sector falls lower than its 2015 level from 2020 to 2044 (Figure 8). Efficiency gains from assumed future standards in the New Efficiency Requirements case reduce delivered energy use in the buildings sector by 2.1%, or 0.4 quadrillion Btu, in 2030 and by 3.9%, or 0.8 quadrillion Btu, in 2050 compared with the Reference case. Updated efficiency standards in the New Efficiency Requirements case affect both residential and commercial energy consumption. In 2050 in the New Efficiency Requirements case, residential delivered energy consumption is 4.7% lower and commercial delivered energy consumption is 3.1% lower than in the Reference case. Removing efficiency standards scheduled to go into effect after 2018 in the No New Efficiency Requirements case results in increased buildings energy consumption compared with the Reference case from 2018 through 2050. Delivered energy use in the buildings sector is 0.6%, or 0.1 quadrillion Btu, higher in 2030 and 1.1%, or 0.2 quadrillion Btu, higher in 2050 compared with the Reference case. Both residential and commercial energy consumption are affected—residential delivered energy consumption is 0.2% higher and commercial delivered energy consumption is 2.0% higher in 2050 in the No New Efficiency Requirements case compared with the Reference case. More efficiency standards are pending for commercial equipment than for residential equipment, leading to a larger effect in the commercial sector.
Among buildings sector delivered energy sources, electricity and natural gas are the most affected in the New Efficiency Requirements case. Efficiency standards affect appliances that run on all fuels, but electricity and natural gas currently account for 88% of buildings energy consumption, and their share of buildings consumption is expected to increase over time in every case. In comparison with the Reference case, buildings sector electricity purchases are 2.4% lower in the New Efficiency Requirements case in 2030 and 3.5% lower in 2050, and natural gas purchases are 2.3% and 5.1% lower, respectively, in 2030 and 2050. The assumptions for the No New Efficiency Requirements case affect buildings electricity consumption more than consumption of other fuel sources. Buildings sector electricity purchases in the No New Efficiency Requirements case are 0.9% higher in 2030 and 2.1% higher in 2050 compared with the Reference case. Although 0.6% higher in 2030, natural gas purchases in the No New Efficiency Requirements case are just 0.2% higher in 2050 compared with the Reference case. Few natural gas-fired residential technologies have standards that are finalized but not yet effective.
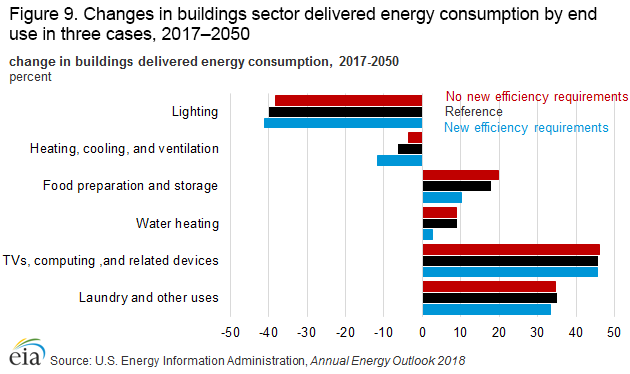
Energy consumption levels for all end uses are lower in the New Efficiency Requirements case than in the Reference case (Figure 9), with space heating, cooling, and ventilation accounting for more than 50% of the difference in 2050. Standards requiring Light Emitting Diode (LED) lighting in the New Efficiency Requirements case contribute to reductions in energy consumption after 2025, but assumed improvements in cost and performance foster increased adoption of LEDs after 2030 in the Reference case, narrowing the difference in energy consumption for lighting late in the projection period. Delivered energy consumption continues to grow for many end uses in the buildings sector, as commercial floorspace and the number of households continue to expand. In particular, continued growth is projected in energy consumption for televisions, computing, and related devices, as well as for laundry and other uses, which includes small devices and other miscellaneous uses that typically are not covered by efficiency standards. Space heating, cooling, and ventilation contribute the most to increased consumption in the No New Efficiency Requirements case. These uses are responsible for 85.6% of the increase in buildings energy consumption compared with the Reference case in 2050. The removal of pending standards for residential and commercial air source heat pumps (2023), commercial furnaces (2023), and ventilation equipment (2026) causes the increases in these end uses. Removing the 2020 lighting standard also results in an increase in residential electricity consumption compared with the Reference case.
Buildings energy expenditures
The reductions in delivered energy consumption in the New Efficiency Requirements case are accompanied by higher equipment costs for consumers. In comparison with the AEO2018 Reference case, residential and commercial consumers in the New Efficiency Requirements case pay an extra $10.8 billion/year (2017 dollars) on average from 2017 to 2050 for end-use equipment and residential building shell improvements. The additional investments by consumers in the New Efficiency Requirements case are offset, however, by savings on energy purchases as a result of efficiency improvements. Compared with the Reference case, consumers in the residential and commercial sectors save an average of $11.5 billion (2017 dollars) in annual nonrenewable energy expenditures from 2017 to 2050 in the New Efficiency Requirements case. Conversely, residential and commercial consumers pay $1.8 billion/year (2017 dollars) less on average from 2017 to 2050 for end-use equipment and residential building shell improvements in the No New Efficiency Requirements case than in the Reference case. However, annual energy costs are higher for residential and commercial consumers in this case, averaging $2.8 billion/year (2017 dollars) more than in the Reference case.
Transportation sector energy consumption
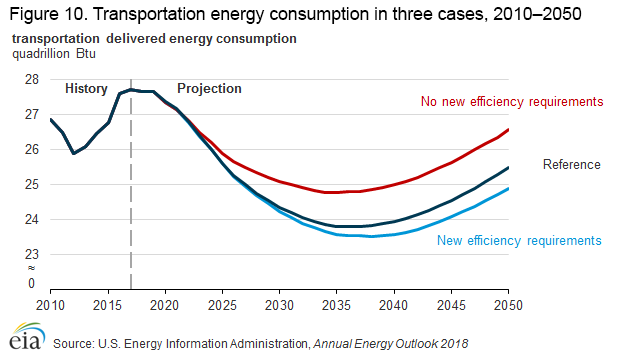
The New Efficiency Requirements case differs from the AEO2018 Reference case by assuming that the joint CAFE and GHG emission standards promulgated in 2012 by EPA and NHTSA for MY 2017 through MY 2025 LDVs are extended through MY 2050. Standards increase at an average annual rate of 0.4% between MY 2025 and MY 2050, reaching 50.9 miles per gallon, compared with 46.5 miles per gallon in the Reference case. Conversely, the No New Efficiency Requirements case holds joint CAFE and GHG emission standards constant at MY 2021 levels through MY 2050, when they are 38.7 miles per gallon.
Transportation energy demand declines by 8% from 2017 to 2050 in the Reference case, from 27.7 quadrillion Btu, or 14.3 million barrels per day (b/d) oil equivalent, to 25.5 quadrillion Btu, or 13.0 million b/d oil equivalent, because rising energy efficiency across all transportation modes outpaces growth in transportation travel and freight demands. This trend increases in the New Efficiency Requirements case, where transportation demand falls to 24.9 quadrillion Btu (12.7 million b/d oil equivalent), or 10% lower than consumption in 2017 (Figure 10). Transportation energy demand in the No New Efficiency Requirements case still drops between 2017 and 2050, but only by 4%, reaching 26.6 quadrillion Btu (13.6 million b/d oil equivalent) in 2050.
The sales of LDVs that do not rely solely on gasoline internal combustion engines for motor power (including battery electric, hybrid electric, diesel, or other alternative fuels) also change compared with the Reference case. The share of conventional gasoline LDVs declines in the Reference case from 87% in 2017 to 71% in 2050, primarily because of rising battery electric vehicle sales that are driven by state policies such as California’s Zero Emission Vehicle (ZEV) mandate, declining battery costs, and the availability of longer-range options for consumers. Sales of vehicles other than conventional gasoline LDVs rise to 31% by 2050 in the New Efficiency Requirements case, compared with 29% in the Reference case, and drop slightly to 28% in the No New Efficiency Requirements case.
Endnotes
-
U.S. Environmental Protection Agency, “Standards of Performance for Greenhouse Gas Emissions From New, Modified, and Reconstructed Stationary Sources: Electric Utility Generating Units” (Washington, DC: October 23, 2015), https://www.federalregister.gov/articles/2015/10/23/2015-22837/standards-of-performance-for-greenhouse-gas-emissions-from-new-modified-and-reconstructed-stationary; and U.S. Environmental Protection Agency, “Carbon Pollution Emission Guidelines for Existing Stationary Sources: Electric Utility Generating Units” (Washington, DC: October 23, 2015), https://www.federalregister.gov/articles/2015/10/23/2015-22842/carbon-pollution-emission-guidelines-for-existing-stationary-sources-electric-utility-generating.
-
In AEO2018, the PTC for geothermal, hydroelectric, and other non-wind technologies was assumed to have expired at the end of 2016 under the then-current law. In February 2018, eligibility for the tax credit for these technologies was retroactively extended to projects under construction by the end of 2017.
-
Detailed projections for the CPP case are available in the AEO2018 Projections Tables for Side Cases (https://www.eia.gov/outlooks/aeo/tables_side.php).
-
2017 and Later Model Year Light-Duty Vehicle Greenhouse Gas Emissions and Corporate Average Fuel Economy Standards, Environmental Protection Agency and Department of Transportation, National Highway Traffic Safety Administration; Federal Register Vol. 77, No. 199, Monday, October 15, 2012. https://www.gpo.gov/fdsys/pkg/FR-2012-10-15/pdf/2012-21972.pdf
Mid-Term Evaluation of Greenhouse Gas Emissions Standards for Model Year 2022-2025 Light-Duty Vehicles, Environmental Protection Agency; Federal Register Vol. 83, No. 72, Friday, April 13, 2018. https://www.gpo.gov/fdsys/pkg/FR-2018-04-13/pdf/2018-07364.pdf
-
2017 and Later Model Year Light-Duty Vehicle Greenhouse Gas Emissions and Corporate Average Fuel Economy Standards, Environmental Protection Agency and Department of Transportation, National Highway Traffic Safety Administration; Federal Register Vol. 77, No. 199, Monday, October 15, 2012. https://www.gpo.gov/fdsys/pkg/FR-2012-10-15/pdf/2012-21972.pdf
-
Reported figures for natural gas generation also include generation from oil, which accounted for less than 0.5% of total generation in 2017 and is projected to further decline in all cases presented in this section.