OPEN DATA
Notice: EIA retired its legacy API (APIv1) on March 13th, 2023. Excel add-in v1 sheets will continue to function as they are. Please refer to our documentation for the APIv2 interaction methods.
Embedding EIA Charts and Maps on Your Website
EIA has added functionality to its data tools to allow users to easily embed widgets of EIA's interactive charts and graphs onto their website. This allows users to easily add official statistics from U.S. Energy Administration's API to their websites. No API key, programming, or library installation is required.
To embed a visualization:
- Use any of the following EIA data tools to create a chart or a map:
- Electricity Data Browser: charts and maps of 500,000 aggregate and plant level generation, pricing, and consumption time series (updated monthly)
- Petroleum pop charts: available on most of EIA's petroleum data pages
- Natural Gas pop charts: available on most of EIA's natural gas data pages
- Coal Data Browser: production, consumption, and world trade charts and maps
- Short-Term Energy Outlook table viewer: charts
- International Energy Data Portal: charts and maps
- Total Energy table viewer: charts
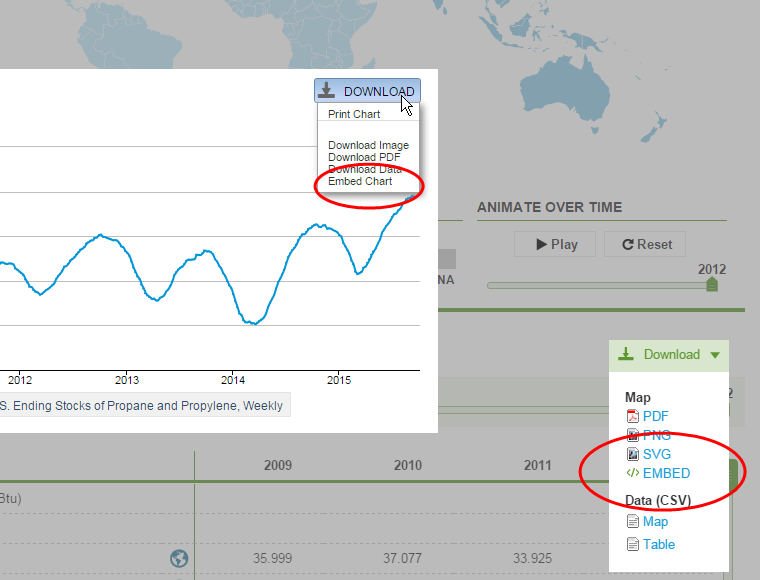
- Click on the "embed" option in the download menu (see image to right) to preview your visualization
- Configure (e.g. change dates or add a drill-down interactive) then copy and paste the tag into your web page
Note that the source key icons API Key from anywhere on the EIA website to link to the time series' page in the API Query Browser to navigate to any of the 1.2 million time series in EIA's data API, and select the "Show me how to embed..." links.
Sample Dashboards
The following sample dashboards demonstrate how a handful of embedded visualizations can easily be assembled to tell a story:
Sample Visualizations
Interactive Chart (125 most recent data points)
Interactive Chart
Interactive Chart with Drill-Down
EIA offers its widgets to the public free of charge under the BSD2 open source license. The library is offered as-is, without support or warranty. User are free to fork it on Github and modifiy the library to suit their needs. The widget uses third-party libraries which may require a license. License details are found on all embed preview and instructions page.