Released: February 21, 2013
Next Release: February 27, 2013
Gasoline prices have risen since the start of the year
The average U.S. retail price for regular motor gasoline has risen 45 cents per gallon since the start of the year, reaching $3.75 per gallon on February 18. Between January 1 and February 19, the price of Brent crude, the waterborne light sweet crude grade that drives the wholesale price of gasoline sold in most U.S. regions, rose about $6 per barrel, or about 15 cents per gallon. A simple calculation, which modestly understates the role of higher crude prices to the extent that crude price increases during December 2012 were still not fully passed through in retail gasoline prices at the start of 2013, suggests that about two-thirds of the rise in gasoline prices since the start of the year reflects higher gasoline crack margins.
With factors affecting global crude oil markets having been addressed in recent U.S. Energy Information Administration (EIA) commentary, this article focuses on some of the major factors behind the increase in gasoline crack spreads. Among these are: planned and unplanned refinery maintenance; the low starting level for gasoline crack spreads going into 2013; preparation for seasonal fuel specification changes; and developments in global product demand that have affected domestic refinery utilization rates, maintenance needs, and product balances. While these factors have played an important role, other factors may also have contributed to recent short-term price movements. Finally, some of the most recent trends in domestic prices and refinery operations and the amount of gasoline headed toward the United States from abroad provide some indication that gasoline crack spreads may soon ease.
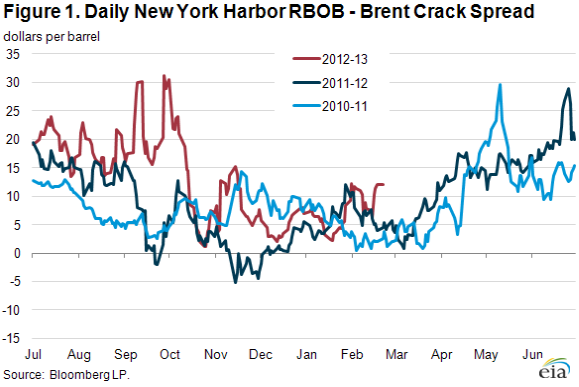
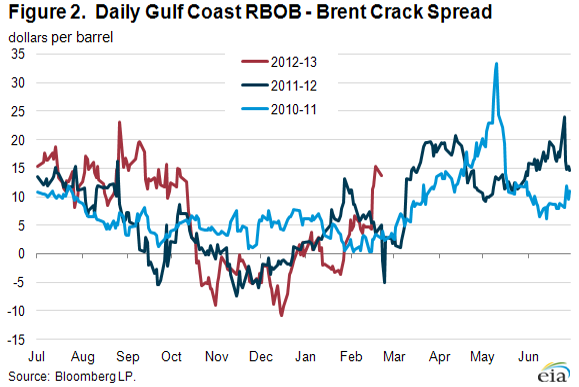
Throughout much of November and December 2012, gasoline crack spreads were very low, and in some cases negative (a barrel of gasoline worth LESS than a barrel of Brent crude). As a result, retail gasoline prices were lower than one would typically expect given prevailing crude oil prices, with the lowest price of 2012 reached in EIA's weekly survey on December 17. Since the beginning of 2013, reformulated gasoline blendstock for oxygenate blending (RBOB) crack spreads versus Brent have increased 12, 34, and 46 cents per gallon, respectively, in New York Harbor (Figure 1), the Gulf Coast (Figure 2), and Los Angeles.
Both planned and unplanned maintenance at several refineries have supported higher crack spreads. Many refineries schedule maintenance early in the year when gasoline demand is seasonally low. Trade press estimates indicate that off line refinery capacity increased from the beginning of 2013 to more than 1.7 million barrels per day (bbl/d) for the week ending February 15. As a result, EIA estimates that gross inputs into U.S. refineries fell 9 percent from 15.9 million bbl/d per day in mid-December to 14.4 million bbl/d for the week ending February 15.
In the Northeast, crude units were reported to be down at Monroe Energy's 185,000-bbl/d Trainer refinery as well as at Philadelphia Energy Solutions' 335,000-bbl/d Philadelphia refinery. Additionally, ongoing refinery outages in Venezuela and a recently resolved outage at North Atlantic's 115,000-bbl/d Come by Chance refinery in Canada supported Atlantic basin gasoline crack spreads. The market's reaction to this string of U.S. refinery outages may have been exacerbated by the late-January announcement that Hess Corporation planned to close its 70,000-bbl/d Port Reading refinery at the end of February. On the Gulf Coast, Motiva's Norco, Louisiana, and Port Arthur, Texas refineries are reported down for maintenance in February, according to trade press. It should also be noted that Gulf Coast crack spreads have been bolstered by the increases in RBOB prices attributable to the switch to summer-grade gasoline. On the West Coast, refinery maintenance has been particularly heavy. At one point in January, almost 300,000 bbl/d of fluid catalytic cracking (FCC) capacity was off line. While some capacity has come back on line, several outages persist in the region. FCC units are particularly important for gasoline production, and FCC maintenance can significantly affect gasoline prices.
While U.S. exports of petroleum products continue at a robust level, the relationship between product exports and domestic gasoline prices is quite complex and exports do not appear to be contributing to rising U.S. pump prices since the start of the year. As U.S. demand for gasoline and distillate has declined, robust global demand for petroleum products has provided Gulf Coast refineries with an export market for gasoline and distillate produced using capacity that would otherwise have been operated at lower utilization rates. In particular, strong global demand for distillate fuels in recent years has been a factor allowing refiners to operate profitably with lower gasoline crack spreads than would otherwise have been possible. While U.S. gasoline exports have also increased in recent years, the United States was still a net importer of gasoline in 2012. Generally, over 80 percent of U.S. exports of total gasoline are produced and shipped from the Gulf Coast, while the vast majority of U.S. gasoline imports enter the country along the East Coast. Constraints on product pipelines between the Gulf Coast and the Northeast regions and the limited availability and expense of vessels permitted to move product between U.S. ports, which must be built, maintained, and flagged in the United States and employ U.S. crews, limit the amount of petroleum products that can be moved economically from the Gulf Coast to the Northeast. Were gasoline exports to be constrained, global gasoline supply would likely decline, and U.S. gasoline importers, especially in the Northeast, would face additional competition for supplies from buyers in other countries that would have otherwise been supplied from U.S. refineries, which would tend to raise the price of imported gasoline.
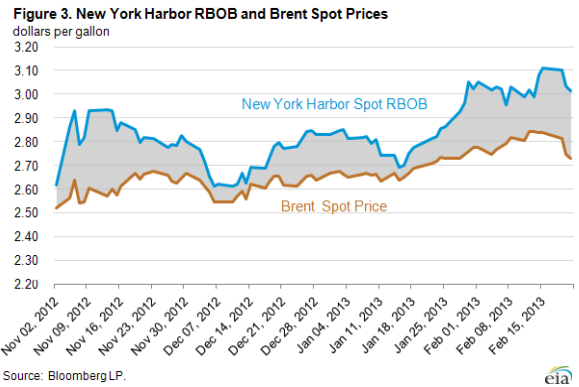
Despite the recent increases in wholesale and retail gasoline prices, there are indications that gasoline crack spreads are beginning to ease. Both RBOB futures and Brent spot prices have declined in recent days, with a larger decrease in the former (Figure 3). Additionally, trade press has reported that 11 million barrels of waterborne gasoline are en route to the United States and Canada. U.S. refinery maintenance typically peaks in February, and we expect that many of the facilities that have recently decreased crude runs should return to normal operations in the coming weeks. However, this increased supply will likely be countered by the seasonal increase in demand, which typically begins in the spring.
Even though pressure on gasoline crack spreads appears to be easing, the short-term outlook for gasoline prices remains volatile. Despite the significant rise in retail gasoline prices since the start of the year, a part of the even steeper rise in wholesale prices has not yet been fully reflected in pump prices. Thus, if wholesale prices were to remain steady rather than decline, a modest further increase in pump prices would be expected. Gasoline pump prices will also be affected by the transition to summer-grade gasoline, which is more expensive to produce than winter-grade gasoline. Gasoline crack spreads will also remain sensitive to future refinery outages. Finally, although this article focuses on crack spreads, crude oil prices are also subject to significant uncertainty and volatility related to economic and geopolitical factors.
Gasoline and diesel fuel prices up again
The U.S. average retail price of regular gasoline increased 14 cents to $3.75 per gallon, up 16 cents from last year at this time. The national average price has seen double digit increases two out of the last three weeks and is up 45 cents since the beginning of the year. The largest increase came in the Midwest, where the price increased 18 cents to $3.76 per gallon. The Gulf Coast price is $3.53 per gallon, an increase of 15 cents from last week. The Rocky Mountain price is up 14 cents to $3.41 per gallon. On the West Coast, the price increased 11 cents, but remains just shy of the $4 per gallon mark at $3.97 per gallon. Rounding out the regions, the East Coast price saw the smallest increase, 10 cents, rising to $3.75 per gallon.
The national average diesel fuel price increased five cents to $4.16 per gallon, 20 cents higher than last year at this time. For the first time since October 2012, prices in all regions of the nation are above the $4 per gallon mark. The Gulf Coast and Rocky Mountain prices both increased seven cents, to $4.07 per gallon and $4.03 per gallon, respectively. The Midwest and East Coast prices are each up a nickel to $4.13 per gallon and $4.20 per gallon, respectively. Rounding out the regions, the West Coast price is $4.30 per gallon, up four cents from last week.
Propane inventories decline
U.S. propane stocks fell 1.3 million barrels to end at 51.1 million barrels last week, yet are 6.2 million barrels (13.8 percent) higher than the same period a year ago. Gulf Coast inventories dropped by 0.6 million barrels, and Midwest regional inventories declined by 0.4 million barrels. East Coast stocks dropped by 0.3 million barrels, while stocks in the Rocky Mountain/West Coast region gained slightly. Propylene non-fuel-use inventories represented 5.7 percent of total propane inventories.
Residential heating fuel prices rise
Residential heating oil prices increased during the week ending February 18, 2013. The average residential heating oil price increased by 2 cents to $4.15 per gallon, 11 cents per gallon higher than the February 20, 2012 price. Wholesale heating oil prices decreased by 3 cents to $3.37 per gallon, 11 cents per gallon higher than last year at this time.
The average residential propane price increased by 1 cent to $2.49 per gallon, 37 cents per gallon lower than the same period last year. Wholesale propane prices also increased by 1 cent to $0.98 per gallon, 18 cents per gallon lower than last year at this time.
Text from the previous editions of This Week In Petroleum is accessible through a link at the top right-hand corner of this page.
 |
 |
||||||
 |
 |
||||||
| Retail Data | Change From Last | Retail Data | Change From Last | ||||
| 02/18/13 | Week | Year | 02/18/13 | Week | Year | ||
| Gasoline | 3.747 | Heating Oil | 4.153 | ||||
| Diesel Fuel | 4.157 | Propane | 2.490 | ||||
 |
 |
||||||||||||||||||||||||||
|
 |
||||||||||||||||||||||||||
| *Note: Crude Oil Price in Dollars per Barrel. | |||||||||||||||||||||||||||
 |
 |
||||||
 |
 |
||||||
| Stocks Data | Change From Last | Stocks Data | Change From Last | ||||
| 02/15/13 | Week | Year | 02/15/13 | Week | Year | ||
| Crude Oil | 376.4 | Distillate | 123.6 | ||||
| Gasoline | 230.4 | Propane | 51.076 | ||||