Released: October 3, 2012
Next Release: October 11, 2012
U.S. Oil Production Continues to Grow
U.S. oil production, including crude oil and lease condensate, has grown steadily since 2008, a change from the two decades of declines before 2008. This growth has been driven mainly by increased production from various tight (very low permeability) formations. (Permeability measures how well liquids and gases can flow through open spaces in rocks.) Horizontal drilling combined with hydraulic fracturing have allowed exploration and production (E&P) companies to access commercial volumes of oil from rock formations that are less permeable than those found in conventional formations. The U.S. Energy Information Administration (EIA) expects that development of tight formations will lead to continuing significant increases in U.S. oil production in the coming years.
Three key basins with tight formations have been the largest contributors to U.S. oil production growth: the Permian Basin in West Texas and southeastern New Mexico; the Western Gulf Basin in southern Texas, which includes the Eagle Ford shale; and the Williston Basin, which extends over parts of North Dakota, South Dakota, and Montana and which includes the Bakken formation (Figure 1).
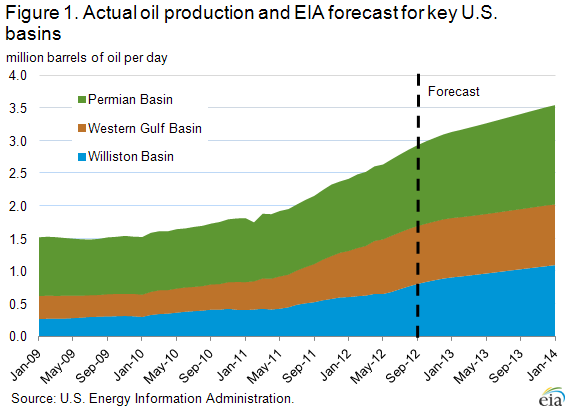
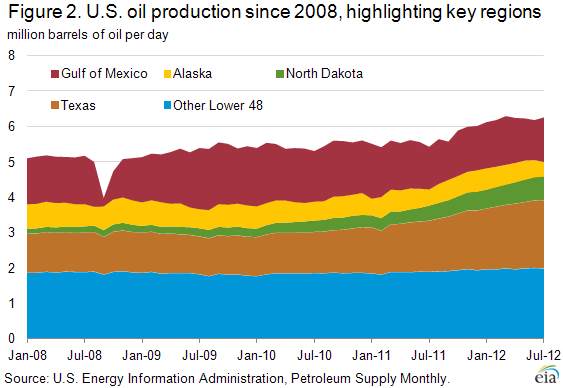
Since January 2009, North Dakota's crude oil production has more than tripled from an average of less than 190,000 barrels per day (bbl/d) to nearly 675,000 bbl/d in July 2012, based on North Dakota Department of Mineral Resources statistics (Figure 2). This growth makes North Dakota the second largest oil producing state, behind Texas and ahead of both Alaska and California. The Bakken tight oil formation has accounted for nearly all of the new production in North Dakota. EIA forecasts total Williston Basin production, including North Dakota and Montana, will approach 1.1 million bbl/d by January 2014.
Texas oil production has increased about 770,000 bbl/d since January 2009, and in June 2012 averaged 1.9 million bbl/d. Texas has seen the largest volumetric increase of any state. The Permian Basin, which was already producing significant quantities of conventional oil, has experienced increases in oil production from both conventional and shale plays. EIA forecasts Western Gulf Basin production to rise to almost 930,000 bbl/d and Permian Basin production to reach 1.55 million bbl/d by January 2014.
The shift of the U.S. drilling rig fleet away from dry natural gas to oil and wet natural gas suggests that the production of oil and other liquids will continue to climb. E&P companies are making significant capital investments in horizontal drilling rigs and deploying them to tight oil plays. Many existing rigs with horizontal-drilling capabilities are being redeployed from plays rich in dry natural gas to those that can produce crude oil and other liquids that have a significantly greater value under current market conditions. The total number of rigs drilling for oil increased 76 percent from an average of 801 in February 2011 to an average of 1,409 in September 2012, based on detailed weekly active rig count data provided by Baker Hughes Incorporated. The number of rigs drilling horizontal wells has grown even more rapidly, increasing from 362 to 823, over the same period. September 2012 data show that a weekly average of 58 percent of the entire U.S. onshore rig fleet was drilling horizontal wells, compared to 45 percent in February 2011. Because horizontal drilling is often associated with tight formations, it is apparent that an increasing number of producers are targeting tight geology.
The geographical distribution of the rig fleet also suggests that E&P companies are directing more resources to drilling for tight oil. In February 2011, North Dakota and Texas already were leading all other states in average number of rigs targeting oil, averaging 150 and 390 per week, respectively. The average weekly oil rig count increased to 182 in North Dakota and 692 in Texas in September 2012. These two states, which produce the majority of the oil from the three key basins containing tight formations with liquids, account for more than half the net increase in rigs over this time period. Based on this information, a large proportion of new and existing drilling rigs are expected to be allocated towards liquids in North Dakota and Texas, and many of these rigs likely will be drilling horizontal wells.
Gasoline and diesel fuel prices decrease for a second consecutive week
The U.S. average retail price of regular gasoline decreased two cents last week to $3.80 per gallon, 37 cents per gallon higher than last year at this time. Prices decreased in all regions of the Nation except the West Coast, where the price was up two cents to $4.08 per gallon. The Rocky Mountain price decreased less than a penny to remain at $3.77 per gallon. The largest decrease came in the Gulf Coast, where the price is $3.56 per gallon, down five cents from last week. The East Coast and Midwest prices both decreased three cents to $3.80 per gallon and $3.78 per gallon, respectively.
The national average diesel fuel price decreased less than a penny to $4.08 per gallon, 33 cents per gallon higher than last year at this time. Prices decreased in all regions of the Nation except the Gulf Coast, where the price is up less than a penny to remain at $4.00 per gallon. The Rocky Mountain and West Coast prices were both down two cents to $4.21 and $4.30 per gallon, respectively. The East Coast price is $4.08 per gallon, a penny less than last week. The Midwest price decreased less than a penny to $4.01 per gallon.
Propane stocks show another strong build
Last week, total U.S. inventories of propane received a large build of 1.3 million barrels to end at 75.6 million barrels, 18.1 million barrels (32 percent) higher than the same week last year. The bulk of the build occurred in the Gulf Coast region, which added 0.9 million barrels. Elsewhere, Midwest regional stocks grew by 0.4 million barrels and Rocky Mountain/West Coast stocks added 0.2 million barrels. East Coast regional inventories fell by 0.1 million barrels. Propylene non-fuel-use inventories represented 6.0 percent of total propane inventories.
Heating Oil and Propane Prices
The weekly heating oil and propane price section containing data for October 1 will not be published on October 3 due to system difficulties. The data for October 1 will be released along with the data for October 8 on October 11, 2012.
Text from the previous editions of This Week In Petroleum is accessible through a link at the top right-hand corner of this page.
 |
 |
||||||
| Retail Data | Change From Last | Retail Data | Change From Last | ||||
| 10/01/12 | Week | Year | 10/01/12 | Week | Year | ||
| Gasoline | 3.804 | Diesel Fuel | 4.079 | ||||
 |
 |
||||||||||||||||||||||||||
|
 |
||||||||||||||||||||||||||
| *Note: Crude Oil Price in Dollars per Barrel. | |||||||||||||||||||||||||||
 |
 |
||||||
 |
 |
||||||
| Stocks Data | Change From Last | Stocks Data | Change From Last | ||||
| 09/28/12 | Week | Year | 09/28/12 | Week | Year | ||
| Crude Oil | 364.7 | Distillate | 124.1 | ||||
| Gasoline | 195.9 | Propane | 75.584 | ||||